


The Big Picture Outline
- Broad Market Outlook
- Sector Rotation
- New Big Picture Idea
- Updated Big Picture Idea's
(click on each chart for a bigger version)
Broad Market Outlook
Last week was an interesting one we came into the week drooling over LULU only to be pushed back into the patience game as it continues to flag at highs. Market wise we watched the market pull back and break a major area we were watching only to get bought back up on Friday.
Nasdaq retested its prior highs, the SPY lagged, while some sectors showed us that retesting the correction lows are in the cards (VDC and VNQ). Our primary names that we focused on last week were all strong names flagging near highs that barely flinched as the market pulled in (AKAM LULU FIVE).
There were some members who saw some losses however you have to take it with stride, when the entire market is selling off, even the best names get pulled down with it. A little red now and again should motivate you to work harder.
This week will be interesting, if we can come out of the gate strong tomorrow we could see some follow through until the end of the week however I would find it hard to believe that this week will be anything less than an inside week.
Know your levels, stick to your game plans, keep risk tight and be willing to try new things like tight risk support buys on the way up (not trying to catch support on the way down).
Thank you to the members who helped last week!
For the rest of the Alpha's if you have learned something valuable from TE or could share your experience by leaving a review on our Facebook page that would be dope.
SPY 300+ 12 Month Price Target

This week we watched how the $270 line in the sand tried its hardest to hold up however eventually failed that level. We as a group did very well avoiding any unnecessary pain during this weeks pull back. We saw Friday some great reaction as the mostly everything that gapped down off the open was getting bought back up.
It seems now that for the week ahead we will be inside this new range between $265 to $280, and just like how we wanted $270 to hold, the market had to push it just enough to shake people out, I would suspect the same when we get near highs of this range.
As of late there has seems to be more of a focus on the SPY to gauge the markets temperature which is fine, how try to avoid getting into the habit of looking at the SPY on a time frame smaller than the daily as it will tend to chop you up more than any benefit gained.
Nasdaq 8400+ 12 Month Target
 Nasdaq has been leading the market for the past year and has retested its prior highs which is a great sign (while the spy has put in a new higher low (not as good a sign). We've seen this chart 9,000 times so I will not waste your time explaining it. All around A+ setup in the making in time Nasdaq is setting up for a breakout to $8,000 which would be 14% higher from the breakout level.
MDY Mid Cap Stocks $400+ 12 Month Target
 MDY showed us that it wanted to respect the prior breakout area which was resistance back in November ($335) which is now started to turn into support (great sign) we can still retest those lows where we should be looking to buy and if we retest highs for the 2nd time, you know what you should be looking to do, if you dont look at the chart of the NASDAQ to give you a better idea (take profits on the 2nd retest of highs)
 IWM Small Caps 200+ 12 Month Target
 $148 in the small caps are showing to be support for now with resistance forming at $156, would expect somewhat of an inside week within this range until there is some major news to rock the market in either direction.
10 Year Treasury Note Yielding 2.85%
 You might start to hear terms like "inverted yield curve" in the media (turn off the tv) or online, and it may seem confusing. There is one historic leading indicator that will give us a big red flag that a recession is on the horizon which is an inverted yield curve.
Very simple an inverted yield curve is when the 2 year Treasury Bill pays more than the 10 year Treasury Note.
Right now 10 year Note is yielding 2.85% (higher = good)
Right now the 2 year Bill is yielding 2.46%
Were Gucci however when the 2 year starts to yield more than the 10 year, that's a red flag.
VGK Europe ETF $82+ 12 Month Target

We can see how $59 has been the level for quite some time, in time this will be a great opportunity for a sneaky buy back.
VWO Emerging Markets +$58 12 Month Target

Higher lows check, definable entry not so check, still somewhat of a choppy level, however $48 is starting to show us an area of resistance and we would expect to see the $45 start to become an area of support.
EWJ Japan +$85 12 Month Target
 $66 is the level, when it wants to go will have to be in for it as its been 20 years in the making.
Sector Rotation
Key points
- For any of the major markets or sectors, we are parking this positions in a taxable account looking to hold for a year plus (Long Term Capital gains)
- Meaning we are willing to hold positions against us as overall sectors and markets are much less volatile than individual names.
- We are buying or adding (dollar cost averaging) when there are actionable set ups.
- We are selling for either profit or getting out for breakeven if better opportunities arise elsewhere .
- If you plan to add this strategy to your portfolio please discuss it will me so we can make sure you are not parking these ETF's in retirement accounts locking up tax deferred capital that can be put to better use in individual stocks.
VGT Tech
 When a stock gets back to a prior high for the 2nd time what tends to happen?
(Last week)
 As we said last week, prior retest of highs tends to be met with resistance as people run for the breakeven exit or the "I sold at highs exit". Tech is setting up exactly how we like it. Shake out the dumb money and let us buy that breakout. This $180 breakout in time should set tech up for a move to $200. Right now if we can get a pull in near $168 and it holds up that would be a great sign. If tech gets right back up to $180 this week I would not expect too much fire works as its needs time to pull in, settle and digest this move. Remember consolations are healthy and are the way for markets to continue to grind higher. Bitcoin died in 2 months because there were zero areas of consolation.
VCR Consumer Discretionary
 VCR found its footing on Friday at $158 above that area a good sign, for now would expect some what of an inside week within this $10 point range.
VHT Healthcare

$156 has been the spot I have been buying for quite some time now, Friday however I missed the chance to add up through it.
VIS Industrial

Last week we highlighted now VIS was running into its prior support level that broke which would create some resistance as it has shown us perfectly. In time we will be buying that $148 as a breakout however for now buying into pain tends to pay (easier said than done).
VDC Consumer Staples
 Consumer Staples has be thee most emotional sector as of late, they were last ones to enter the breakout party and the first to show up to the breakdown one as well. So far were seeing that $136 has now been defended twice, if this is the starting of a double bottom could be a great low risk entry however below $136 could expect some lower prices.
VAW Materials

VAW has been battling with $134 for 6 months now, this is probably not the last time we will see it set up under this level that is why we continue to nibble into each sector vs trying to bet the house on one entry.
VPU Utility
 My $112 support buy is now showing us that it wants to become resistance, we should expect at least a retest of lows ($105) however really would like to see it hold up vs $100 which has been support since 2016. Will add above $112 in time if given the chance to buy near $100 will look to add there.
 VDE Energy Sector
 VDE $94 has been the area we have been buying and on Wednesday just ticked us in only to pull back $4 which sucked however that $90.10 bid helped to ease the pain on that add. Will add again through $94 when given the chance.
 VOX Telcom
 VOX is starting to get its footing a bit however still in this overall macro down trend, just like with energy last year it there was around a 6 month time frame for energy to consolidate before finally turning around, could expect a similar situation in telcom where $90/$92 will be the spots to add down the line. Stock specific wise VZ down near $44 I will look to add.
 VNQ REIT

REIT's have been an avoid after the new tax changes as the news for them was not so hot to say the least, so far we have seen how $72 has been a pretty significant line in the sand if you zoom out you can see this area has been support since 2014, this is the 4th major attempt at this support level. Above $72 this $74-$76 range are some low risk areas to get in however below $72 there really isnt much areas to defend it until you get down to $64. Started to nibble at $75 and will look to add above $76 in time.
VFH Financial

VFH is showing us that it is respecting the prior support level of that last bull flag, above $70 looks good, will need some time for a break of this flag around $73.
The New Big Picture Set Up
The Big Picture SWKS $172+ 12 Month Price Target

This SWKS $112 has been a level since Shake and myself were trading next to one another on the Mook desk. This $112 looks sick however we want to see it pull in and settle out a bit, as its just ran $17 points in a month. Earnings are out of the way and tech has already been leading this market higher. We give SWKS the proper room and $112 should be like CAT $114 that was good for $50-$70 in a year.
Triggered $112.05
Stop $92.89
Big Picture Target $172+
The Big Picture's Updated
The Big Picture SHAK $60+ 12 Month Price Target

You guys remember when Shake called SHAK through $38 that was good for almost $10 as well as it triggering the Big Picture $40 level. After that run it, has traded as we expected, retesting $39 and attempting to shakeout that prior $37 area that we were originally buy against.
Now this is when we want to keep an eye on SHAK for the sneaky buy back up through $39 again.
 Started to buy and add through $39 for now stop still the same and will look to add through $40 in time.
Triggered $39.05
Stop $36.49
Big Picture Target $60+
The Big Picture LULU $110+ 12 Month Price Target

This LULU gave us the textbook shakeout this week and ripped higher, now just two weeks ago we were looking to buy $80 a week later, some were getting shaken out at $80. What a time?
With that being said, black spanx's are still battling with this highs, and earnings are not until April, so we have some time if this wants to get going. However if not, not the end of the world. So far the tightest risk stop on a Big Picture Trade since NKTR that was a $1 stop.
 Seems we have been trying to be too perfect in this LULU that it is just chopping us up in this $2 range, feel like we are going to look back at this in 6 months wondering why the fuck we kept it so tight. $82.50 seems to be the area that needs to clear with some authority, going to give it some more space and let it work itself out.
 Triggered $82.05
Stop $74.89
Big Picture Target $110+
The Big Picture WUBA $140+ 12 Month Price Target

WUBA has spent the last 3 years getting back to those prior highs, and when the market was at highs, just enough people were able to push it through those highs to take about that perfect level. However after the dirty shakeout that followed as the market corrected WUBA put in a higher low (good sign). $84 will be the level we want to keep an eye on.

Took a day 1 paper cut in WUBA when it ticked $80, will buy back in time.
Entry $80.05
Stop $75.89
Big Picture Target $140+
The Big Picture CVX $160+ 12 Month Price Target

We made a mistake when we were focusing on the energy sector and that was focusing on XOM sure chart wise it was a great value play and had the smallest amount of risk from our entry the overall headwinds were still south.
Yet the leader CVX received much more love. So far we can see how there's two key areas we want to watch, $120 and $134 while the real line in the sand has been above $100 in CVX for going back as far as October 2016.
If Energy continues its overall weakness as it hovers near support of its wedge, we want to keep an eye on CVX to see if it can hold up vs $100. If it can great signs where we can start small and add through levels. This will be a patient one. Remember this is a heavy thick oil name, not a light and wide bio tech.
 So far the low risk buy looks to be a breakeven trade which is no biggie, we are starting to see how $116 is where the sellers are for now. If these lows get taken out will look to add in the low $100's.
Entry $116.05
Stop $107.89
Big Picture Target $160+
The Big Picture WVE $80+ 12 Month Price Target
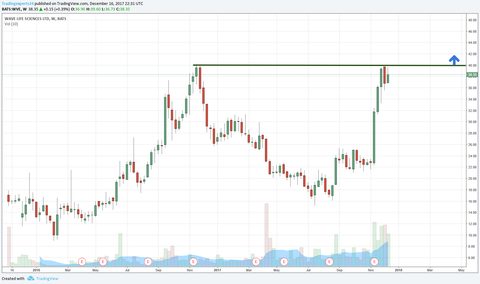
WVE is a recent new issue biotech, as we have seen this name has been a beast this past month and showing its hand that $40 is still the major level (2nd time retesting it) where we can expect the sellers who were trapped from the first go around to take stock off for as close to break even as possible.

WVE has been digesting that 37% move in a week, would expect some more selling pressure as the $50 support buyers left the party for now. Stop is still breakeven and will be looking to add when it sets up.
Triggered $40.01
Stop Upped $39.89
Big Picture Target $80+
ALNY $280+ 12 Month Price Target
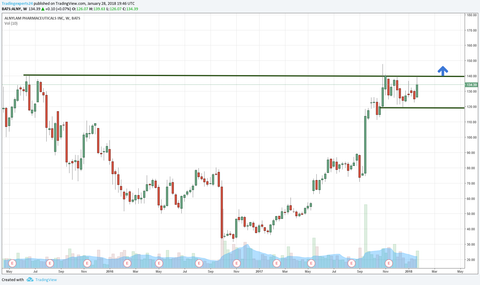
ALNY has been setting up for this $140 level for quite some time now, which looks somewhat similar to ENTA a prior Big Picture Idea that's up 50% in 8 weeks. Now will it trade exactly like ENTA?
Probably not, however chart wise we know $140 is the level that we need to be in for.

ENTA took around 2 months near highs before going, ALNY has been flagging in this $20 range for 3 months now.

ALNY's problem has been volume, chart wise $124 is the area to get started for the $140 level however its just lacked the juice. Took a paper cut in it which was a $2 loss that I would take any day. Will have to buy back $124 again.
Feeler $124.05
Stop $115.89
Big Picture Entry 140.01
Big Picture Target $280+

Trip Update's
Members - JD, Kriss Knapp , Mo, Sam, Rob Eskew, Carl and Gina Theodore, and 6 girls that I know.
Maybe's - T Fresh, Scott Kee
Flight - flights are still pretty cheap, if you are considering going, your first step would be to get your flight locked in, as they will likely cost around $2,000 in May when right now you can find a ticket for around $500.

View from the 7 Bedroom house
Game Plan
Thursday - arrived, get food and drinks, get to ocean front villa, relax and get dinner
Friday - boat rented for the day to travel to all the other islands, see the pigs, go to the island where Pirates of the Caribbean was filmed.
Saturday - Longer Term Financial Planning Discussion
Sunday - Taxable vs Tax Deferred Trading

Any questions about the trip PM me and we can discuss. $50 off for any referral you send to TE.

An impressive share! I’ve just forwarded this onto a co-worker who has
been doing a little homework on this. And he
in fact ordered me lunch due to the fact that I stumbled upon it for him…
lol. So let me reword this…. Thank YOU for the meal!! But yeah, thanks for spending time to talk
about this subject here on your site. https://www.siliconebraclets.xyz