


The Big Picture Outline
- Broad Market Outlook
- Macro Rotation
- Sector Rotation
- Sub Sector Rotation
- New Big Picture Idea
- Updated Big Picture Idea's
New Business
How to Swing with Sharks will be released on July 1st!

Broad Market Outlook
Another great week in the books for the Alpha chat as a whole and from a rough estimate there was at least $50,000+ locked in. However there were a few alarming things that were witnessed and need to be addressed. These two red flags will burn the lazy trader when the tide turns.
The first major one was "bored" trading, as in simply putting on risk to put on risk, by far the dumbest thing one could do especially during summer trading. The second was random reward, there were a few trades in question that were pure luck that caused massive winners such as forgetting a stop or oversleeping. It is all fun and games until you wake up on the other side of the bed starring at a sea of red. The music has been playing in our favor for a while now, don't let your ego overlook the fact that when the music stops, it stops fast and without mercy.
Globally I will be keeping my eyes on Europe and Emerging Markets as they are currently presenting the best risk reward DCA's around. Sector wise materials are showing its hand as well as financials while the rest broadly just seem too extended short term to expect much out of them.
This is and will continue to be a stock pickers market as it seems that we will continue to be in this range bound market for the time being compared to the breakout market of 2017. Chart wise there are a ton of opportunities out there however you want to keep focused on the task at hand. Do not let the fomo or the flash in the pan derail you from your bigger picture goal.
This is investing not betting black or red at the roulette table. If you are thinking that options are the way to go yet you were about to quit during the correction, have a plan for when the crap out occurs. Owning stock and having a series of 1% losses can keep you in the game for decades, a series of 100% losses on failed options, good luck making it to labor day.
Save weekly, lock in profit, read daily, review your winners and losers and put on risk when it makes sense.
Macro Rotation Outlook
Cheat Sheet
Nasdaq stop vs 7,100 cautiously optimistic
S&P 500 above 278/280 good, below 272 look out below
Dow Jones retest of support seems in the cards
Mid Caps avoiding
Small Caps stop vs 166
Europe $57 DCA*
Emerging Markets $43 DCA*
China $110 DCA
Japan holding
India $34 DCA
Russia holding
10 Year 3% flagging
USD cant sleep on 95
Oil lower highs, lower lows
Nasdaq 8400+ 12 Month Target

Could Nasdaq continue to grind higher towards our 12 month target, why the fuck not? What's strong tends to stay strong much longer than one could expect, however we have to take a look at the bigger picture or the other side of the trade that we tend to want to turn a blind eye toward. We have seen these recent steep up trends that quick are reversed at the first sign of weaknesses, now the most recent run has been slower and more gradual which has been a good thing however these rug pulls are quick. We have already taking out new highs twice since the correction this year which are great signs however we are a long way from support. Given this year seems to be more of a range bound year than a breakout year that we experienced in 2017 we have to be aware of where we are at. Still a stock pickers market just have to do your homework.
SPY 300+ 12 Month Price Target

As you are starting to see that volatility dies in time, after the correction we saw much wider swings however as the market becomes aware that the world isn't ending the volatility suppresses. We have seen the market grind higher forming higher lows since April, and really since May we have been getting paid as any pull back was buy able. We are getting closer to this inflection point where it is either a breakout of this $278/$280 area or a break of this uptrend and a possible retest of $254. Bigger picture wise the latter would be healthier for us to eventually really take out $280 with power where if we take it out sooner and don't retest those lows or shake the tree, I would expect that break out to be the same as getting a box of sparklers on 4th of July. Regardless of what happens if we breakdown, under $272 see you later, and if we want to break above $280 hold on tight. Whatever is meant to happen, happens.
Dow Jones 300+ 12 Month Price Target

Are the Dow 30 showing us some signs of what is to come in the SPY? The Dow ran right into that prior pivot high and recently broke the uptrend it has been on since May, which at this point seems a retest of the $230 area is in the cards.
MDY Mid Cap Stocks $400+ 12 Month Target

We can see clear as day that the Mid Caps did a great job retesting the pre correction highs however as we all know that the retest of a major level tends to be met with resistance as anyone who has been trapped can finally get out for breakeven.
IWM Small Caps 200+ 12 Month Target

Small caps have done a great job picking up the slack from the lagging large caps and there are plenty of lines in the sand in the IWM, could we go vs $158 or $160 and give it room? Sure, however the small caps have gone on such a stupid run its time to hold your cards close to the chest, stop vs $166.
EWJ Japan +$85 12 Month Target

Japan has rolled over to try and retest this lows of this range, picked up some stock on the way up vs lows and will continue to look to add as we know the 20 year $66 level is in the cards at some point down the road.
VGK Europe ETF $82+ 12 Month Target

Europe so far is giving us probably one of the best set ups, even though to most it probably looks like shit, it looks so bad that it looks good, down here vs lows its about $.50 per share risk where a $3-5 move is a lay up. Will be DCA'ing above $57
GXC China +$150 12 Month Target

China is showing us the great wall is $107 and could DCA above $110 however it seems it might need just a little bit more time to pull in and or settle out.
VWO Emerging Markets +$58 12 Month Target

Similar to Europe the Emerging Markets look like shit right, just at lows where the obvious move seems lower, however those tend to be the best spots to buy, now I'm not trying to bid in and catch lows, fuck that shit. I will add above $43 where my risk is a mere 2 gumballs per share, and if it works and this downtrend wants to break, this DCA will be the winning buy to turn this hold around.
INDA India +$53 12 Month Target

India is setting up for a clean $34 DCA on around $1 risk, really like how it shook out those prior lows and came right back, were still in a bit of a consolation period so its not betting the house on the add, just picking up some stock.
RSX Russia +$30 12 Month Target

We got a nice DCA back near our prior after the retest of that gap down low, it seems in time $21.50 will be the real point to buy for now just holding what we got.
10 Year Treasury Note Yielding 2.90%

The 10 year is starting to flag in this 2.7-3% range seems like we will see higher yields in time.
You might start to hear terms like "inverted yield curve" in the media. There is one historic leading indicator that will give us a big red flag that a recession is on the horizon which is an inverted yield curve.
Very simple an inverted yield curve is when the 2 year Treasury Bill pays more than the 10 year Treasury Note.
Right now 10 year Note is yielding 2.90% (higher = good)
Right now the 2 year Bill is yielding 2.54%
USD

Ok USD we see you trying to take out $95, however will need some time. Remember strong dollar is bad for stocks, bigger picture wise the dollar has been weak af for a long time.
OIL

Lower highs and lower lows started to pick up some SLB as it came back into support while the other oil names still seem to extended short term that are worth the add, could oil set up and hold above $72 a barrel for the next leg? Time will tell.
Fun fact there is 42 gallons of gas in a barrel of oil which comes out to around $1.74 per gallon. So when your at the pump paying $3-$5 now you know why these countries fight over it so much.
Sector Rotation
Key points
- For any of the major markets or sectors, we are parking these positions in a taxable account looking to hold for a year plus (Long Term Capital gains)
- Meaning we are willing to hold positions against us as overall sectors and markets are much less volatile than individual names.
- We are buying or adding (dollar cost averaging) when there are actionable set ups.
- We are selling for either profit or getting out for breakeven if better opportunities arise elsewhere in other sectors.
- If you plan to add this strategy to your portfolio please discuss it will me so we can make sure you are not parking these ETF's in retirement accounts locking up tax deferred capital that can be put to better use in individual stocks.
Cheat Sheet
VDE avoiding
VGT 185 stop
VIS in time DCA
VCR avoiding
VAW 134 DCA*
VHT avoiding
VFH 70 DCA*
VPU stop 113
VNQ holding
VOX took profits, waiting for pull back
VDC patience
VDE Energy

avoiding
VGT Tech

Tight stop under $185.
VIS Industrial

Industrials are still not quite there yet however starting to show us the start of a spot to get in, for now seems that we need to see more pain before trying to get in/
VCR Consumer Discretionary

Missed the last leg however seems not losing sleep over it, avoiding for now.
VAW Materials

Remember health care when we kept buying $156 until it worked (peep below), it seems that $134 could be a similar spot for VAW, sure we would love a $128 DCA however we might not be given the chance.
VHT Healthcare

Healthcare is showing us how $156 could be similar to what VAW $134 is showing us, now in VHT I sold a bit early however that's trading. For now it seems VHT might be running out of a bit of steam into this prior pivot high.
VFH Financial

Financials have came a long way in 2017 and have spent most of 2018 consolidating the monster move they went on. With interest rates rising which will increase things like those 30 year mortgages everyone needs. Banks are being handed a golden platter to clean up now this will take time however it seems the major headwinds are in the banks favor. There are still some great deals out there in the leaders that a year from now we will be wondering why we didn't buy more.
VPU Utility

Had a great DCA two weeks ago and currently all 4 DCA's are profitable, for now have a stop vs $113 and will let it continue to work.
VNQ REIT

Got out a little early on the VNQ however was a great trade that was good for 4:1, $86 is a major major level however got plenty of time before that's a level that we will be trying to buy.
VOX Telcom

Bigger picture it is still in this major downtrend however we can see the range its been in, pulling back, ripping, pulling back, now we were trying to buy the breakout which clearly was the wrong move. As of late we have been buying into support and selling into the rips, still holding some shit stock from higher prices however were getting paid to do so (dividends).
VDC Consumer Staples

Telecom and Consumer Staples have both been in the dog house this year, now for telecom we were booking profits as it was still in its overall macro downtrend, where as for VDC we can see that it is finally started to breakout from the overall downtrend it has been on. So for the DCA stock that we got so far 3 of the 7 adds were profitable. Its time to sit back and hold onto this one and find more spots to add.
Sub Sector Rotation
Cheat Sheet
WOOD 78 Sneaky Buy Back
IHE 156 add in time
IBB 114 resistance 109 support
XT 37.25 DCA
BND basing
WOOD

Was wrong on the 3rd times a charm $83 buy however we are getting a sneaky buy back up through $78.
IHE Pharmaceutical

Pharma has been good to us where we were able to make money in all 4 DCA's and now we are seeing it try and set up vs this $156 which could be a spot to add however it seems some type of shake is needed before it can really bust through this $156 with power.
IBB Bio Tech

Got shaken out before the 2 day rip however made good money on 3 out of 4 DCA with the last one being for lunch money profits. Now we are seeing $114 is the next level and that $109 is support, will need some time to find the next spot to add in this one.
XT Exponential Tech

Lot of levels in this guy, for now the next spot to add will be $37.25
BND Bond Market

$79 is the prior breakdown level that is now acting as resistance.
The New Big Picture Set Up
The Big Picture STX $74+ 12 Month Price Target

STX has been setting up for this soft level at $60 for a few months now since we will be DCA'ing into it we will be giving the first DCA $6 worth of room so we dont LULU ourselves for months before it finally goes.
The Big Picture's Updated
The Big Picture DHR $130+ 12 Month Price Target


$104 is still the real level however we can pick up some stock above $100 vs the recent double bottom.
DCA $100.05
Big Picture $104.05
Stop $99.89
Big Picture Target $130+
The Big Picture AFL $60+ 12 Month Price Target

This $46 level in AFL has been setting up all year and as of late it is handing us the tightest risk entry as possible, now sure the real out is $1.50 lower however we are seeing how we can sneak in on less than $.50 risk.

A nickel keep us out of this $46 buy and as it pulls in we should be able to get a decent DCA.
DCA $45.06
Big Picture Entry $46.05
Stop $44.89
Big Picture Target $60+
The Big Picture EDIT $100+ 12 Month Price Target

We started to nibble on this EDIT through this recent $38 level however we know $44 is the real level in this somewhat new issue biotech, will be looking to continue to DCA up through $40, $42 and than the Big Picture level of $44.

We got some good stock up through $38 and some ehh stock through $40, bigger picture this $42 is the real spot we want to keep a close eye on.
DCA $42.05
Stop $33.89
Big Picture Target $100+
The Big Picture AKAM $150+ 12 Month Price Target

We recently traded AKAM back in Feb/March and caught a nice little chop in it, as of late after a pull it, its marching right back to those $78 highs. Now doesn't this 20 year level look somewhat similar to an old friend of ours?

Remember little $25 NKTR that set up during a similar 20 year level.
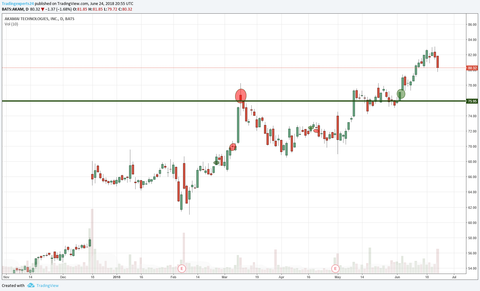
In these bigger picture trades a weakness of ours has been holding through the first pull back as we focus on squeezing as much out of each trade, AKAM will be a good test to see if we can weather this pull back and hold for the next leg.
Holding
Stop $76.89
Big Picture Target $130+
Next Trading Experts Retreat has been selected!
Turks and Caicos

Airport Ticker PLS
Dates August 9th to the 12th
Thursday to Sunday
Cost will be $1249 if paid in full by end of June (6 days left)
Cost will be $1349 if paid in full by end of July
Cost will be $1498 if paid by August 9th
So far the Turks crew will be Shake, myself, Rob, JD, Kriss, Gina, Carl and Max!
15 Alpha's attending we will be chartering a 100 foot yacht for the day!

30 Alpha's attending and we will be renting a 20,000 sq foot villa

Any questions please let me know


Every wasted moment degrades your clarity of purpose
Hurrah! In the end I got a blog from where I can actually get helpful facts regarding my study
and knowledge.카지노 테이블