


The Big Picture Outline
- New Business
- Broad Market Outlook
- Macro Rotation
- Sector Rotation
- Sub Sector Rotation
- New Big Picture Idea
- Updated Big Picture Idea's
(click on each chart for a bigger version)
Broad Market Outlook
We did very well with the oil names last week as VDE finally broke that level following Oil breaking $70 a barrel (3rd times a charm). Markets are at in interesting spot right smack in the middle of its correction range. This chop is not going anywhere anytime soon and its more or less a coin flip on where we are heading, if we roll over we almost want those prior pivots to get ran through to shake people out. Those shakeouts are what turn the market around, when we hold levels too perfectly that's when we get these slow melt ups.
Europe showed us that it could break the downtrend on a similar pattern that our markets are currently showing us however it was a very lame break to say the least.
Sector wise it seems most of the sectors have tighten up quite a bit where last week there were only a handful of spots that were adding up on low risk buy backs, where for this week going forward there are quite a few flags with clear levels to add up through.
Stock wise and newsletter wise going to start to shift more towards a DCA'ing approach to the bigger picture ideas so we can come from a more calculated approach to these trades and less of the having to be perfect on price and time of these major patterns actually going.
Macro Rotation Outlook
Nasdaq 8400+ 12 Month Target

Somewhat in limbo, could just as easily be banging on 7,000 or H'ing back over to blow through 6,300, as much as I want to be an optimist and say that were leaning towards the former (heading back to 7,000) the price action just has not been showing us that. If I was a gambling man, I would say that we take out 6,300 and shake the tree, just long enough for the street to start bitching and moaning, only for it then to rip it higher however Bigger Picture still feel 2018 will be a consolation year where we need to be buying when the market looks like shit and selling when it looks amazing (the exact opposite of 2017 which is frustrating most market participants, which is exactly what Mr Market wants). Last year the market was up to much to buy into, now its not high enough to get into. There is always a story for the complainer, however the one who finds the opportunities usually is too busy getting paid.
SPY 300+ 12 Month Price Target

We trade this pattern all day long and we know the answer is time, could we still get a push to 270 to 275 this week? Sure, however a more realistic outcome is a dip back into this range if it ever wants to punch through this level. Above $268 good, below $254 get your shopping lists ready.
Dow Jones 300+ 12 Month Price Target
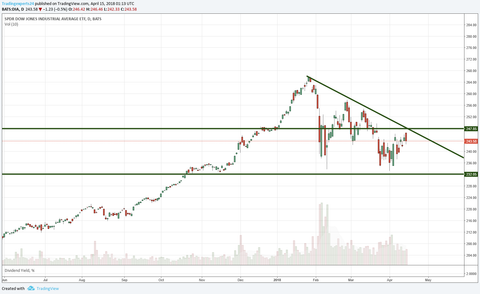 Dumb money hypes the Dow, omg its at 25,000 that's too crazy?! Yet the number does not matter, its simply the 30 largest companies, forget the number and just trade the chart, (rather buy individual DOW 30 names than buy the DIA) however you might like to keep it simpler. $248 is resistance, $232 is an area we don't really want to be tested too many times.
 MDY Mid Cap Stocks $400+ 12 Month Target

Same story different index, this pattern will take some time, tighter stops and be prepared for any rug pulls to load up.
IWM Small Caps 200+ 12 Month Target

VGK Europe ETF $82+ 12 Month Target

Maybe the guys across the pond are showing us that our markets can break these lower highs that we have been putting in recently, however the key take away was how long VGK consolidated for, that was the 10th time VGK battled with $59 to break it, when were looking at the market as a whole, need to expect a major level to have more attempts before finally taking it out.
VWO Emerging Markets +$58 12 Month Target

$47 is showing us the add in VWO and $45 has been building up some strong support for now.
EWJ Japan +$85 12 Month Target

I wont spare you with the $66 talk, or am I? For now we are seeing EWJ getting tighter and tighter, will be adding above $61.
INDA India +$53 12 Month Target

RSX Russia +$30 12 Month Target
 After news on increased sanctions in Russia, the ETF that tracks the overall Russian economy gaped down a casual 9%, image the shit show that would occur in our markets if such a gap down happened? Picked up some on the way up into the gap fill.
10 Year Treasury Note Yielding 2.83%

10 year T Note has been in this range from 2-3%, in time we should see that 3% breakout, we just want to make sure the 10 year is always yield more than the 2 year T Bill.
You might start to hear terms like "inverted yield curve" in the media (turn off the tv). There is one historic leading indicator that will give us a big red flag that a recession is on the horizon which is an inverted yield curve.
Very simple an inverted yield curve is when the 2 year Treasury Bill pays more than the 10 year Treasury Note.
Right now 10 year Note is yielding 2.83% (higher = good)
Right now the 2 year Bill is yielding 2.36%
Were Gucci however when the 2 year starts to yield more than the 10 year, that's a red flag.
USD

Weak dollar = Good for stocks.
OIL
(last week)

3rd times a charm at that $70 level in Oil should see higher prices in time. Fun fact there is 42 gallons of gas in a barrel of oil which comes out to around $1.66 per gallon. So when your at the pump paying $3-$5 now you know why these countries fight over it so much.

We can thank that $70 breakout in Oil for the breakout in VDE.
Sector Rotation
Key points
- For any of the major markets or sectors, we are parking these positions in a taxable account looking to hold for a year plus (Long Term Capital gains)
- Meaning we are willing to hold positions against us as overall sectors and markets are much less volatile than individual names.
- We are buying or adding (dollar cost averaging) when there are actionable set ups.
- We are selling for either profit or getting out for breakeven if better opportunities arise elsewhere in other sectors.
- If you plan to add this strategy to your portfolio please discuss it will me so we can make sure you are not parking these ETF's in retirement accounts locking up tax deferred capital that can be put to better use in individual stocks.
Cheat Sheet on Sector Rotation levels
VGT Hold
VIS $140 Adding
VCR $161 Adding
VAW Hold
VHT $156 Adding
VDE Prior LOD Stop on Add's
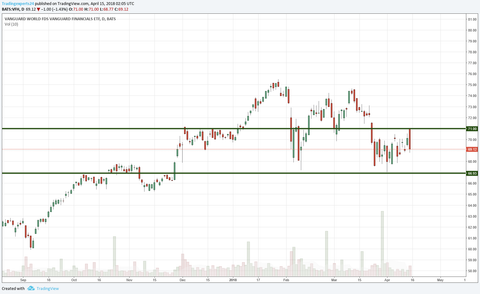
VFH $71 Adding
VDC $137 Adding
VNQ $75/$76 Adding
VPU $112 Adding
VOX $87 Adding
VGT Tech

We had a nice add to VGT two weeks ago, for now seems like we are going to be fighting with that $180 for some time, anything above $164 is all fair play.
VIS Industrial
 Now I will be the first to admit, I have been trying to avoid this sector recently after going on a crazy almost 50% run last year, maybe it was Theo's consistent focus on this sector that has helped nudge my tune more positively or my infatuation with tight risk adds. Who knows, all I know is I will be adding above $140.
VCR Consumer Discretionary

We had a nice add on the way up two weeks ago, now we are seeing that $161 could be a spot to add. Its key to remember when dollar cost averaging, we are not betting the farm on an add.
VAW Materials

We had a sick add in VAW two weeks ago and since has been grinding higher, nothing really chart wise worth an add well see if those $138 sellers will still be there in time.
VHT Healthcare

We have navigated this VHT like snipers as of late, $156 has been a battle ground and will have to start looking to add $156, even if this time it isnt ready, in time this will be the key area that it will need to breakout from.
VDE Energy
(last week)

Energy has really been the only sector with a clear definable setup, we have been trying to break this $94 for almost 3 months now, still in this $4 range and getting tighter. Stock wise CVX $118, SLB $66/$68, XOM $77 had all been setting up as well. Leader is CVX and my primary focus stock wise, sector wise this $94 should give us a move to least $104 on the short term when it finally goes.
 Thanks to Oil finally breaking $70 a barrel we caught some great follow through in VDE that has already gone the $4+ from the range it was in. Now we can still see $100+ in VDE however now that it has broken out, we want to be playing more defense, than trying to add. Prior days low or current LOD would make sense depending on how much you like your price on your adds.
VFH Financial
VDC Consumer Staples
 VDC could be a mini lesson in DCA (dollar cost averaging) something we tend to avoid with the names we trade, however when your buying all the major sectors, you have to expect a little red in the waters from time to time. So far we have been adding and for the most past half dozen times I have been wrong. As of late however that tune is finally starting to shift in our favor, now we are seeing a flag forming and will add above $137, now we are in a more offense type mode like VDE two weeks ago.
VNQ REIT

$76 is the real battle ground in the REIT space however will start to nibble above $75 and add more above $76, if $74 wants to break, its close friends (support) of $73 and $72 are right there behind him, however below $72 his crew thin's out quick.
VPU Utility
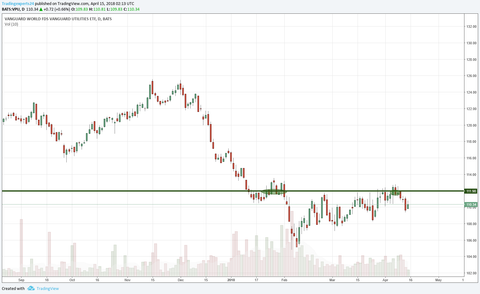 VPU still battling with $112, will add more the next time it wants to break that level.
VOX Telcom

Similiar to VCR, I was wrong 3 times recently on the VOX add's however as of late the add up vs low's has paid off so far and now we are seeing $87 becoming the next level, now telecom is still no where near out of the woods as it is still in this major downtrend. For now I will add above $87 and will look to also be adding to VZ above $48.
Sub Sector Rotation
Cheat Sheet on Sub Sector Rotation levels
KBE $49 Adding
WOOD Holding
IHE $150 Adding
IBB $108 Adding
XT $37 Adding
KBE Bank's
 The banking sector is showing its hand through $49 however below $46 could see a move back to the low $40s.
 WOOD Timber
 Slowly grinding higher, anything vs $76 is fine.
IHE Pharamaceutical
 Added up through the recent highs however the pharma's lost there momo, will except some type of pull in as long as it holds up vs $142 its all fair game, next add up with be through $150
IBB Bio Tech

So far IBB has held $100 ($300 pre split) like a champ so far however still in a wide 8% range, so far we got two decent adds up in the middle of this range, the next spot with be $108 that will need to break, if we continue to flirt with $100 we should prepare for lower prices.
XT Exponential Tech
XT is a basket off 200+ younger tech stocks that are composed of developed and emerging market companies that create or use exponential technologies. Some of there top holdings other than NFLX, are INFY, SKY, GOBI, SPLK, XPO and many others. Think of XT as new (young) tech like MU while AAPL or AMZN technically are somewhat old tech. While MSFT, CSCO and INTC are legit dinosaurs. Regardless all we care about are the charts and $38.50 for 3rd times a charm looks as textbook as they come. Real out is vs $35, for now a feeler above $37 to start could make sense.
The New Big Picture Set Up
The Big Picture DIS $160+ 12 Month Price Target

It is starting to seem that for these bigger picture idea's, it is harder to really pick the exact day to get in and stay in for the major move, where for these idea's going forward similar to sector rotation. I am going to focus more on the spots to add vs the real outs to focus more on slowly building into each of the Big Picture Idea's to help separate away from the momentum buys that need to be exactly perfect.
This should in time help in two major factors, one will help instill more patience and also help nudge the idea of dollar cost averaging where you can really be in for the bigger % moves vs the heavier faster moves. There is no one with a gun to your head saying pick one or the other, just more of a mental mindset, where one might be a shorter term trade while the next might be something you want to set aside and hold.
For DIS we were already adding down near $99 vs $98 on super tight risk, and started to add $101. For now Big Picture the level that needs to break is $112 now you and I both know simply just buying $112 day 1 like trying to buy ALNY at $140 is a hard ask for most, yet if your already in from 10% lower, its much easier on the mental capital to add when the time is right.
When it comes to dollar cost averaging for each entry you want to be light, 1% of your overall capital could be a good starting place. Example if you have $100,000 you would invest $1,000 each time, also giving each add at least a week before adding again. If you have $10,000 it would be $100 or 1 share DIS at a time. Now sure this sounds boring AF and that's the point, when its boring you can let the stock breathe and you can hold through the ups and downs. Remember we are looking to get into this positions for the longer term, 3,6,12+ months, it might be boring the first few weeks with the positions, however you and I both know those small percentages add up in time. Same goes with DCA.
Feller $102.05
Big Picture Entry $112.05
Stop $95.89
Big Picture Target $160+
The Big Picture's Updated
The Big Picture NVRO $130+ 12 Month Price Target

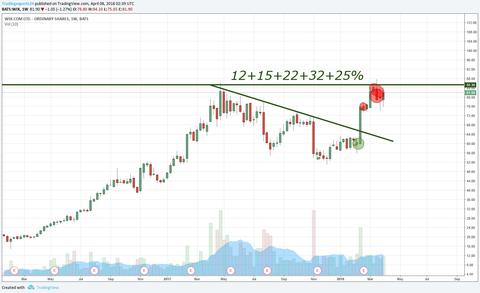
NVRO has been setting up for this break for over a year now, we can see how $90 is still the level that needs to break and could just as easily still pull back in a bit, however in time NVRO is setting up for what could be a WIX type move.
 Now I will be the first to admit that I mooked and took some profits early however that's life, if NVRO does break with some juice will be looking to sell at $107 to sell at that prior high than hold some for the Big Picture move.
 Tried to be cute with NVRO earlier in the week and got ticked out by $.09 only to have to buy it right back at the same price two days later, the real out is vs $83, not going to let NVRO LULU us, $90 still seems to be the spot to add through however the day to day price action is showing that it might need to pull in a bit before really breaking this down trend with some authority when it does finally take out that prior pivot high, will need to be a hold at least to the 52 week high.
 Triggered $90.05
Stop $82.89
Big Picture Target $130+


 The feeler add through $40 has been ok so far, WVE is starting to show us that it cares more about $42 will be looking to add through there in time.
 The $42 entry gave us a nice 10% pop day 1 however we have seen this time and time again where if the stock cant really sustain a great day 2 follow through on huge day 1 moves they tend to fade it in time. One of the largest doji's one has seen where the indecision in WVE was a 15% range intraday was a sign to look for an exit to figure out whats going on. Got rid of the higher priced stock and sitting on the $40 adds. Any pull in vs $36 will be looking to add back up $38/$40 if given the chance.

 MU had to shake the tree before that monstrous breakout, we want a shakeout in LULU to get ready for a feasty move through that $82, a push down through $75 would be ideal.

 We got jerked around for months in this LULU and it finally broke on great earnings, be patient, this is all new price discovery, pick an amount of stock that you are willing to give back to $77.89 and lock em away. Trade the rest how you see fit, however if we had to flip a coin and say LULU higher or lower than $78 in 3-6 months would have to say higher. Should be looking to at least to $100 for now.


 Almost 2 years in the making, $160 will be the level to buy.


The Big Picture MOMO $70+ 12 Month Price Target
MOMO has been on our radar as of late from a technical standpoint, however do you know what MOMO does as a business? Crazy question I know, however they are the Chinese Tinder. I don't want to get too deep into the fundamental story because were traders however knowing this information and seeing how successful both Tinder (owned MTCH) has been as well as Bumble (owned by Badoo private). Both extremely successful business here in the states, however in China its a much bigger market that people are willing to pay for. Now MOMO is a subscription business which is consistent however it is not a sexy bio tech. Need to hit up the Red Army and find more out about it if it really is the next Bumble of China or the next Tinder.
Chart wise could sneak in at $38 however it seems best to just let this thing really set up and take it through $40 and look to add above $46 which is where we should expect the real move to be.
That $38 seller in MOMO really flexing, for now seems that even if MOMO can bounce and tickle $38 it seems like a breakdown through $34 is probably going to be the more likely outcome which is fine, MOMO went on an almost 100% run recently, a little shake of the tree doesn't hurt us as long as we are not in.
Feeler $38.05
Entry $46.05
Stop $32.89
Big Picture Target $70+
The Big Picture WVE $70+ 12 Month Price Target
We caught a nice move in WVE where a few of the members literally caught the top of the short term move for over 30%+ in a week, I on the other hand was not watching it as closely and got stopped out for most for a measly 19%, cue up the baby violins.
Recently it started to drift back down towards the prior breakout level of $40/$42, so far I have taken two small shots in it and see how I am just too early which is fine with me.
It closed under $40 and other than $37 below that line in the sand it has a far way to go until the next pivot. For now its just on the radar for adds above $42 for an eventually move to retest those prior highs and down down the line to take those highs out. Given the blood in the streets this week, felt it was best to have this more of as a stock to watch not a stock to go out and buy just yet.
The feeler add through $40 has been ok so far, WVE is starting to show us that it cares more about $42 will be looking to add through there in time.The $42 entry gave us a nice 10% pop day 1 however we have seen this time and time again where if the stock cant really sustain a great day 2 follow through on huge day 1 moves they tend to fade it in time. One of the largest doji's one has seen where the indecision in WVE was a 15% range intraday was a sign to look for an exit to figure out whats going on. Got rid of the higher priced stock and sitting on the $40 adds. Any pull in vs $36 will be looking to add back up $38/$40 if given the chance.Triggered $42.05
Stop $35.85
Big Picture Target $70+
The Big Picture LULU $110+ 12 Month Price Target
This LULU has been wearing down the patience of most however Big Picture wise its just chilled and for the most part has been doing everything we would want in a stock. Consolidating at highs on tight risk. For this name to really get going still feel it needs to really shake the tree before we are going to see a powerful momentum break of $82. Lets look at MU for example.
MU had to shake the tree before that monstrous breakout, we want a shakeout in LULU to get ready for a feasty move through that $82, a push down through $75 would be ideal.Now lets take a look at another name that spent a few months also consolidating near highs. Same name also had a shakeout that is barely noticeable on the chart now before ripping for months.
In LMT I just kept buying it the tightest flag for months only to eventually stop myself out the day before the start of what became a $100 point rally. LULU is reminding me of the same story.
We got jerked around for months in this LULU and it finally broke on great earnings, be patient, this is all new price discovery, pick an amount of stock that you are willing to give back to $77.89 and lock em away. Trade the rest how you see fit, however if we had to flip a coin and say LULU higher or lower than $78 in 3-6 months would have to say higher. Should be looking to at least to $100 for now.Short term this tight trend line is one asking to break and shake the tree, however bigger picture if you give it the right room and time, and avoid trying to micro manage LULU it should pay you.
Triggered $82.05
Stop $83.89
Big Picture Target $110+
The Big Picture JAZZ $220+ 12 Month Price Target
JAZZ has been off our radar for almost a year now as we last tried it through $156 however we were too early. Recently it has been started to set up for a move through $156/$160 eventually through that area we should see JAZZ take out those prior highs.
Almost 2 years in the making, $160 will be the level to buy.Trigger $160.05
Stop $143.89
Big Picture Target $220+
The Big Picture CVX $160+ 12 Month Price Target
We made a mistake when we were focusing on the energy sector and that was focusing on XOM sure chart wise it was a great value play and had the smallest amount of risk from our entry the overall headwinds were still south.
Yet the leader CVX received much more love. So far we can see how there's two key areas we want to watch, $120 and $134 while the real line in the sand has been above $100 in CVX for going back as far as October 2016.
If Energy continues its overall weakness as it hovers near support of its wedge, we want to keep an eye on CVX to see if it can hold up vs $100. If it can great signs where we can start small and add through levels. This will be a patient one. Remember this is a heavy thick oil name, not a light and wide bio tech.
This CVX has been moving in waves, down $10, up $10, down $10 up $10, had to add through $118 however seems that short term the oil names are running out of steam, still have the lower cost basis stock however not giving back anything in the higher priced ones. Took some off and will look to get back in once there is a more defined entry.
Entry $118.05
Stop $117.89
Big Picture Target $160+


where to buy sildenafil https://eunicesildenafilcitrate.com/ sildenafil 100 coupon
vardenafil nortwest pharmacy https://vegavardenafil.com/ vardenafil tablets 20 mg
Яндекс
wholesale nfl jerseys https://servidor.nortecsoluciones.com/~vida/content/cheap-jerseys-80876
With havin so much content do you ever run into any issues of plagorism or
copyright violation? My site has a lot of completely unique content I’ve either created myself or outsourced but it appears a lot
of it is popping it up all over the internet without my authorization. Do you know any solutions
to help prevent content from being ripped off? I’d
genuinely appreciate it.
Thanks in support of sharing such a good opinion,
article is nice, thats why i have read it fullyla
카지노