The Big Picture Outline
- New Business
- Broad Market Outlook
- Macro Rotation
- Sector Rotation
- Sub Sector Rotation
- New Big Picture Idea
- Updated Big Picture Idea's
____________________________________________________________________
New Business
Trade Theory 11/31
Trading Experts App 12/31
____________________________________________________________________
Broad Market Outlook
We are back! After 7 months of a slow grind to new highs, we are finally getting a shake up in the market that we all needed. Now for most this is your second (mini) correction and it was great to hear from so many of you who were pretty much all cash (Valentino, Darrin and Nick Neef are a few ringing a bell). I say mini because the Nasdaq spend a mind blowing 5 minutes in correction territory, the SPY and DOW at worst were only down 7% off All Time Highs, and only the Small and Mid caps actually made it into correction territories, we were given the red flags two weeks ago. Now during this small period of time (last correction top to bottom was 7 days and only an hour was actually spent in correction territory) and what happened last week can real fuck up months and years of hard work, I am not talking about PnL's or charts, I am talking about what we do. Throw a little red on the boards for a few days and most want to get there bear coat on and dusting off those option's for dummies book they never read before. Or throwing around lingo that when asked what the definition of it is, they shrug there shoulders. Easy market, hard market, slow market, fast market, choppy or boring market, keep shit simple. Leave the theories and other non sense elsewhere.
Ask yourself during the last correction, was it smart to short when the market was down 7-10%?

No, it was actually the dumbest thing humanly possible and those who got short when everyone and there mothers wanted to get short, got there faces ripped out. So why is this time any different?
So lets try this question again, is it smart to short now when the market is down 7%?
Now I still feel and have said this before that we could easily retest new lows however either move back through highs or to new lows will be a choppy one to fuck most people and push them away from the market only for them to come back and chase it higher. If you are now going to start flip flopping daily between buying and shorting stocks, I wish you good luck. If you do feel that you now need to be a shorting hero just know who warned you and just flip the chart upside. This is the first time all year that bases have really turned into bear flags. If you are looking to short a leader at highs, just get the shovel out. You want to short, find losers that are hugging near lows that once those lows get taken out everyone long is fucked. Trying to short a name where the only people fucked is anyone who got long in the last 12 hours is a fools errand.
The action on Friday was very telling, and I try to avoid putting much weight into such small time frames however the gap up to almost prior days highs made it extremely improbably for any real follow through, scanning every S&P, Nasdaq and Dow name most were doji's that eventually faded. The buyers quite frankly didn't have the balls to step in and turn the tide. Will this week be any different is anyone's guess. There is soo much out there right now that just needs some time to settle out and set up. Sectors and charts who are giving us prices we have not seen in months. Instead of wasting your time finding a 5 minute reversal in the SPY, look at individual names, there's a lot of deals out there.
Sector wise across the board we saw mostly all sectors pull in anywhere from 5-13% of highs, I am not here trying to catch lows, however with cash on the side lines I will continue to add to this sectors when they turn. Each day last week I was moving buy stops down from the high of days and eventually picked up VAW at $122 on Friday when on Monday I had an order in above $130, could VAW head lower? Sure however with major markets and sectors we tend to get paid much more buying when the market is scared. Stock wise this tends to be much harder as a stock can easily get cut in half in a month while a major sector like Materials that usually is not in the cards.
Stocks that I will be keeping an eye on LOXO 170, BIIB 350, NTLA 25, LLL 200, XPO 104, CE 102, CARA 20, ABBV 96, APY 46, HI 51, BA 370, MMM 204, CSCO 46, CAT 145, INTC 46, KO 45 and VZ 54.
____________________________________________________________________
Macro Rotation Outlook
Cheat Sheet
Nasdaq 5 minutes in correction territory
S&P 500 only down 7%
Dow Jones only down 7%
Mid Caps in correction territory
Small Caps in correction territory
China down trending
Japan back near support
Europe new lows
Emerging Markets new lows
India held lows
Russia range bound
10 Year breaking out
Bond's breaking down
USD flagging
Oil back near prior resistance
Nasdaq 8400+ 12 Month Target

Nasdaq officially touched correction territory for all of I shit you not 5 minutes, 300 seconds was as long as it could last yet people beg and brag that they will load up the truck during these few minutes yet most never do. Market wise we needed this and should expect more of a range bound market to continue to form. When they is the case you are paid to buy stocks when the market is near support and look to sell them when the market is near resistance.
SPY 300+ 12 Month Price Target
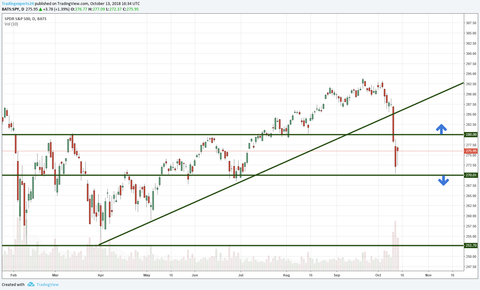
The SPY finally broke support after the 4th major attempt at support when guess what most people were calling for it to hold because it was soo obvious. Now the SPY only pulled in 7% off highs, with 270 being a major line in the sand, given the market action on Friday, the gap up and basically doji for most names the buyers were not there. I still feel we can retest and put in a new low on the year which bigger picture wise would be great for us. Now do I expect us to smoke 270 Monday morning and retest lows in another few days, most likely not, we had a sharp sell off, and to squeeze and fuck with longs and shorts a snap back could be in the cards.
Dow Jones 300+ 12 Month Price Target

The DOW like the SPY also pulled in around 7% off highs where they are hanging in prior areas that we would normally look to buy however there was no real shakeout yet.
MDY Mid Cap Stocks $400+ 12 Month Target

Mid caps still following the Small Caps which have been showing us where the market has been wanting to head, below 336 we should expect a retest of lows however given the already 10% pull back off highs a bounce could be in the cards.
IWM Small Caps 200+ 12 Month Target

Small caps warned us last week as the downtrend broke and so far is still in correction territory as it pulled back as much as 12% off highs. Above 156 could be a spot to pick some back up however the Small caps are showing us how possible it is to pulling in a new 52 week.
GXC China +$150 12 Month Target

EWJ Japan +$85 12 Month Target

Sometimes its better to be lucky than good, took off all of my Japan position and now I can get right back in (light) support will most likely break and flush lower however if it still wants to play in this range I will have no problem picking some back up.
VGK Europe ETF $82+ 12 Month Target

Europe took out new lows after support broke, should expect some continuation to the down side and will avoid trying to add until it can make a move back above prior support.
VWO Emerging Markets +$58 12 Month Target

Macro downtrend continues however not too scary just a little breakdown.
INDA India +$53 12 Month Target

RSX Russia +$30 12 Month Target

Similar to Japan, locked in some gains in Putin as it ran into resistance, filling this gap will take some time so in no rush to jump back in until there is a good deal on the tabe.
10 Year Treasury Note Yielding 3.14%

As rates continue to rise we will continue to see the 10 year inch higher which crushes bond prices as you will see below the bond market just put in a new low as the 10 year is putting in a new high.
You might start to hear terms like "inverted yield curve" in the media. There is one historic leading indicator that will give us a big red flag that a recession is on the horizon which is an inverted yield curve.
Very simple an inverted yield curve is when the 2 year Treasury Bill pays more than the 10 year Treasury Note.
Right now 10 year Note is yielding 3.14% (higher = good)
Right now the 2 year Bill is yielding 2.86%
BND Bond Market

As rates rise expect to see the bond market continue to put in new lows.
USD

The USD has been having a hard time holding this area, remember weak dollar good for us.
OIL

After a monster run since August Oil is starting to pull back into prior resistance.
Fun fact there is 42 gallons of gas in a barrel of oil which comes out to around $1.88 per gallon. So when your at the pump paying $3-$5 now you know why these countries fight over it so much.
____________________________________________________________________
Refer a friend to Trading Experts and receive a free month
Or
If you would like to do us a Small Favor by leaving us a review, there will be a surprise at your doorstep before the next Big Picture.
____________________________________________________________________
Sector Rotation
Key points
- For any of the major markets or sectors, we are parking these positions in a taxable account looking to hold for a year plus (Long Term Capital gains)
- Meaning we are willing to hold positions against us as overall sectors and markets are much less volatile than individual names.
- We are buying or adding (dollar cost averaging) when there are actionable set ups.
- We are selling for either profit or getting out for breakeven if better opportunities arise elsewhere in other sectors.
- If you plan to add this strategy to your portfolio please discuss it will me so we can make sure you are not parking these ETF's in retirement accounts locking up tax deferred capital that can be put to better use in individual stocks.
Cheat Sheet
VGT bouncing
VDE near support
VIS 140 DCA
VOX 83 DCA
VAW 124 DCA
VCR 168 DCA
VFH 68 DCA
VNQ 77 DCA
VDC 138 DCA
VHT avoiding
VPU avoiding
____________________________________________________________________
Sensitive - sectors that have moderate correlations to overall market conditions.
VGT Tech

That rising wedge that we talked about for the last 3 months finally broke to the downside where now it seems we should be expecting more of a range bound market to start to form vs the prior highs.
VDE Energy

Energy back into the support area of the range however seems to easy to jump back in, looking for a flush of prior lows.
VIS Industrial

VOX Telecom

____________________________________________________________________
Cyclical - sectors that are more sensitive overall market conditions.
VAW Materials

VCR Consumer Discretionary

VFH Financials

This is a good example as to why we DCA, so we can continue to pick up more stock as time goes on, now that major support has broken, lower prices seem in store however if that is not the case I will have no problem adding above 68.
VNQ REIT

Reit's coming back into value territory however still seems it has some legs for some continued downside until we start to add.
____________________________________________________________________
Defensive- sectors that tend to outperforming during sub par market conditions.
VDC Consumer Staples

That $144 pivot was a strong one, not really the time to be jumping into staples.
VHT Healthcare

VPU Utilities

Utilities even put me to sleep until they were near support they are off my radar.
____________________________________________________________________
Sub Sector Rotation
Cheat Sheet
IBB 112 DCA
ITA 204 DCA
IBB Bio Tech

IBB in correction territory and back into what was a solid range, still a bit too early however this is a level to keep an eye on.
ITA Aerospace & Defense

Now was that a close one, took this off for a 5% gain and right back to where we were buying in the end of August, this is a prime example of buying an ETF, we held for a month, we were always green, we collected a dividend payout and made 5%, now in a stock you could have made that gain in a day (or lost it) in an ETF they tend to move much slower.
____________________________________________________________________
The New Big Picture Set Up
The Big Picture HPQ $32+ 12 Month Target
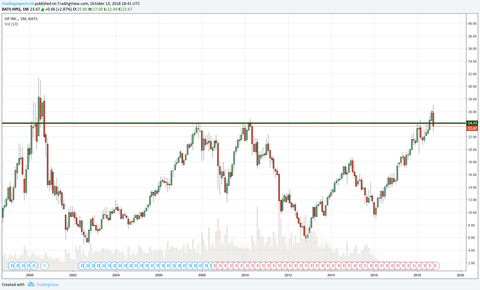
We took this HPQ in September and it went on a nice little $2 run however just wasn't ready, now this is a decade long level, its going to take some time.

HPQ is reminding me alot of PFE, where it had a quite move, came back smoked anyone trading it than months later ripped. If we can see some more weaknesses in HPQ, we should be able to get some great stock for a move higher however this might take a few months.

If you remeber PFE, we caught a 2 day 6% move in PFE which is a huge move for this time of value name that HPQ also fits into. After the breakout it ripped through support and took months to set back up. Something similar that I expect to see in the overall market and most stocks. Months and months later it finally went. This is what I am expecting for HPQ.
Big Picture Target $32+
Big Picture Entry $25.05
DCA $24.05
Stop $18.89
____________________________________________________________________
The Big Picture's Updated
The Big Picture ABBV $125+ 12 Month Target

Been trying to catch this ABBV all year and caught a few cute trades in it however nothing to loose sleep over. For the last year ABBV has been battling with the $100 level, and as of late it has been getting tighter and tighter near an inflection point. I will be looking to DCA from $96 to $100 for an eventual move back toward the prior highs.

For how beat up the pharma's were this week and how weak ABBV has been overall this year, she held up pretty good, the 96 level is still intact for this downtrend break.
Big Picture Target $125+
Big Picture Entry $100.05
DCA $98.05
DCA $96.06
Stop $87.89
The Big Picture CARA $40+ 12 Month Target

What a beauty aint she? Now sure this isn't a hard level as $22 has been tested and broke a few times prior, however its back here for the 6th time over the last 4 years. Now lets take a closer look.

June it gaps up right towards that level, sells off hard (no big surprised after a 30% gap up) than it climbs right back however nope that $22 seller is still there, than over the next few months its fades and than climbs right back to $22, yet the seller is still there holding the stock down. Now is it going to break $22 Monday morning at 9:31 and never look back? Probably not, that's why we can DCA $22 if it does, hold it, if it ticks it and is still not ready, than you have plenty of ammo to add later.

Cara was not ready the first time however it is giving us a tight entry at $20 just remember that it is around 10% risk on this DCA so be light.
Big Picture Target $40+
Big Picture Entry $24.05
DCA $20.05
Stop $17.89
____________________________________________________________________