


The Big Picture Outline
- Broad Market Outlook
- Sector Rotation
- New Big Picture Idea
- Updated Big Picture Idea's
(click on each chart for a bigger version)
Broad Market Outlook
Now was it really that scary? For most of you this was your first correction with the Trading Experts. Market was down 12% at its lowest in a wild week, yet are you down 12%? Probably not, shit you might even be slightly up, flat or a little red.
If your up on the week, you put risk on when 98% of the market was throwing there hands up bitching and moaning about the exact thing they were asking for over 100+ weeks. Basic human psychology at its finest. Ask Mr Market for a correction, he will grant your wish, just never when you really want it and usually when you least expect it.
Even in the chat we saw greed and fear at major inflection points during the calm before the storm through out the worst of it. The last few days of January, the level of euphoria was an 11 out of 10. We saw members talking about purchasing Audemar Piguet's and others how they could been up X amount if they kept up the returns they achieved in a short window.
Than when the markets got rocky, a short week later. The euphoria turned to "should we look to short?" "should we buy support?" "the market is dead there are no set ups".
Now for most it was a very smart idea to be in cash and on the side lines. However the big red flag was that most did not want to get to work when the going got tough.
We even saw this on the professional side talking with peers who would say "this isn't fun" "I like it when there's less volatility", just blankly starring back as there complaints in the summer was how they could not make money with no volatility.
Market cycles tend to change every 6-8 weeks, the last 6 months** were the easiest market conditions we have ever seen during our tenure learning from Mr Market.
Just when it gets the easiest is right before it tends to get very difficult, now broadly for most who do not have a plan. They unfortunately will meet the Rothstein Mr Market who gives the braggarts some easy wins so he can come back bet heavy and clean them out.
For us nothing has changed because you do not gamble. You game plan, you execute, you learn, and your always hunting for new opportunities. As the market will start to move much more emotionally we can capitalize on it.
5,000+ stocks out there and there are still names flagging at highs. We just have to find them. There are 140+ set of eyes in the Alpha chat. If you do the math, if everyone focused on just 35 stocks. We would have the entire market covered.
The Alpha Chat is a team, you can lean on Shake and myself for help as much as possible, however we can only do some much. As a group there is no reason why the chat should not put up $2,000,000+ in profits this year.
SPY 300+ 12 Month Price Target

You have witnessed or traded through your first correction with Trading Experts. Now it might have been a little scary however all par for the course. We corrected 12% from all time highs and as of the end of Friday we started to see some broad based buying (smart money tends to mark the close). Now we are not out of the woods yet. Lets take a peep at the last correction that also occurred (at that time) at all time highs 100+ weeks ago. $252 is the new line in the sand for now however as history has repeated itself, in time it seems that level can get retested even if we V bottom from here back to highs as that high is now a mental ceiling for the entire market.

You can see how after the initial correction we started to form a new range and still retested those lows a hand full of times. If we can start to see this action currently it would be very healthy for the market to continue higher in time. Remember this is the market we are talking about. Stocks can take weeks to flag and form ranges, markets are much slower. The last consolidation took around 2 years to breakout, while the prior major consolation (dot com, financial crisis and recovery) took almost a decade plus. If we start to form a range and consolidate for the next year it could be very healthy for the market.
However we still will have to take it week by week and adjust our outlook. We are getting into market conditions that most have not scene before where there still are name that are flagging just harder to fine and you have to really pull out your contrarian tool belt and look to buy when people are quiet and be selling when everyone is chattie.
Nasdaq 8400+ 12 Month Target
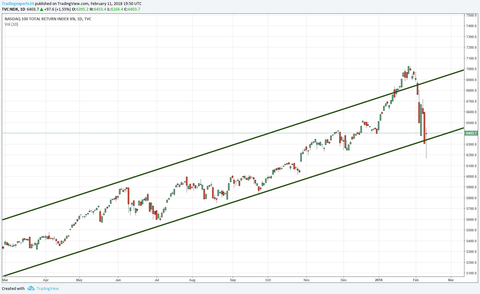
Support of this range finally pushed through, we should expect the highs and lows of this correction to start to form more of a consolidating range, however do not expect it to be perfect as during this times when the market is forming new levels it will surely shake the tree as we saw on Friday, off the open market was smoked, by the close virtually every sector was green. If you are prepared this is a time where you can grab big swings and also a time if you take your eye of the ball that you can give back hard earned profits. Know yourself and know your weaknesses. 6,100 is the new line of sand that we want to see hold for now.
MDY Mid Cap Stocks 400+ 12 Month Target

Mid Caps retested and shook the tree through its major level of support, this is why we do not want to be in the game of catching support. We want to see how it reacts that buy back up vs the low. $320 is the new line in the sand, anything above we should see the Mid Caps trade in that range vs the prior highs where most will look to sell creating a mental ceiling for now.
IWM Small Caps 200+ 12 Month Target

$142.50 is the new line in the sand that we want to see hold for now, however in time it seems that level will have to still get tested to push people out. So far IWM is trading the most technically with the new level of major resistance being the prior high where most will look to now sell after this correction.
VGK Europe ETF $82+ 12 Month Target

VGK pulling back (sounding like a broken record now) for now will be looking for more pain and will start to add vs the gap up lows if given the opportunity than eventually adding up through $59/$60 area in time.
VWO Emerging Markets +$58 12 Month Target

VWO same story as Europe didnt have the juice on the 2nd major attempt will look to start to add much lower if given the chance and than down down the round will be adding back up through $48 and $50.
EWJ Japan +$85 12 Month Target
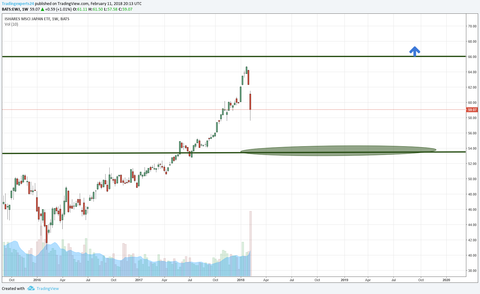
Japan $66 probably one of my favorite macro set up out there however its been in motion for 20 years so its not like we are expecting it to go tomorrow and be like NKTR and be up 200% in a month. For now it formed a double bottom vs $58 however given the huge amount of selling pressure it has seen, would expect a small bounce and the 3rd time back down to $58 should expect the selling pressure to continue. Will be keeping an eye if that happens how it can hold up in the mid $50s. The real buy is $66 down down the road.
Sector Rotation
Here is a big lesson in Sector Rotation and how quick things can change, last week Utilities VPU and REIT's VNQ were at the bottom of the barrel as the laggard and this week as most sectors are cleaning house. These were the fan favorites.
VPU Utility Sector

Was too early to the Utilities base back through that $112, for now its in some what of no mans land. Will keep an eye to add near support ($100) or back up through $112 in time.Sector wise closed the strongest Friday aka people still a little scared out in these streets.
VNQ REIT Sector

REIT's held a major level this week holding prior support of $72 which is a major line in the sand. Myself personally I was looking for an eventual move down to $64 however we might not get what we wished for. For now if $72 can really hold will be looking to start adding above $75/$76 in this sector.
VGT Tech Sector

This is why we use stop losses, the Line in the Sand stop keep you out of the correction (Charts Tell The Story. However lets switch gears for a mini support buying lesson.
Green circle - gap up,hardest buy, no one knows that will ultimately becoming the new lows when in the moment its the new highs.
Yellow circle - the first major retest of what is now becoming support, highest probability time to try it. You can bid in, however take note trying to be perfect with a tight stop into support is asking to get pushed out. This is a time to buy back vs the low.
Red circle - 3rd major time when it becomes so obvious everyone is calling out the support buy and this is when it tends to smoked everyone trying to get that perfect price. Same story as the 2nd test, instead of trying to catch it. Buying back up tends to be the move.
VFH Financial Sector

So far the new line in the sand is $67 where the financials can form a new $6 range however given the easy almost lay up rally they have been on all year, might have to expect some more pain before any cheering. Below $67 keeping an eye on $64, $60, $58.

VHT Healthcare Sector
Just as fast as they rally tends to be just as fast as they crash. We caught a monstrous 10%+ rally in Healthcare from the $156 breakout back in the first Big Picture of January. We were able to take it for around 8% of the rally and started to buy some back near the prior breakout level. Few days early as its always easier to be the Monday Morning Quarterback than in the game trying to score. As we saw the $150 area of prior support flush, in time will be adding more through $156 for a retest of prior highs as virtually anyone who can look at a chart will be trying to sell there.
VIS Industrial Sector

Line In the Sand again keeping you out of virtually all of the pain of the correction in this sector. So far $134 is the current low however given the run this sector has been on, I would not be in the biggest rush to jump back into this sector.
VAW Materials Sector

The Materials sector is getting near its longer term support, as we have been seeing the more times it continues to get near support the more likely it is to shake some people out. However if this is the low will be looking for a post to add through $134 (no rush).
VDC Consumer Staples
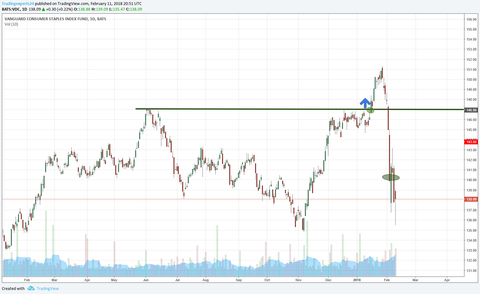
VDC chart is a prime example of how quickly a chart can go from Kate Upton to that what was I thinking moment the following day. VDC was a great lesson learned on how even sector wise that breakeven stops can be beneficial. Given these are not individual stocks we try to not trade them as such and try to just stick with them. However that Line in the Sand stop is clear as day (all lessons). Added into pain and was too early. For now $135 is the new line in the sand and it now seems $143 is the new battle ground from $147. Side Note we absolutely murdered KO and JD put WMT in a body bag on that swing from $100 to $110. Both of which are showing decent opportunities to get back in.
VCR Consumer Discretionary

One week your on top of the world (VCR) next week your at the bottom of the barrel. VCR was on such a nutty run that this waterfall h pattern is very healthy. We could see a bounce however would be hard to believe to see it get back above $166 with much authority. If your in your line in the sand is $152 trying to lighten up into any bounce. For now off the radar.
VDE Energy Sector
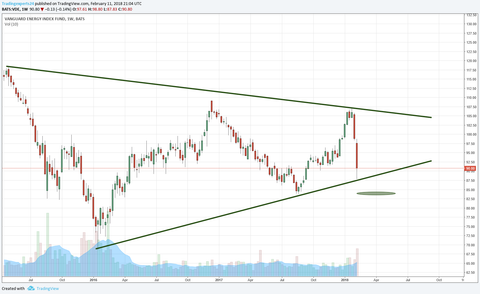
The Energy sector has been singing a similar tone as the Consumer Discretionary sector, last weeks winner turning into this weeks loser. However there are some crazy opportunities in staple names. There were dozen's of people wanted to buy CVX $132 now its $20 off (still on the radar vs $100) there are still deals in HAL, SLB and XOM. However chart wise CVX is by far the leader. Will be hawking CVX down the road that $132 3rd times a charm should be a meaty one.
VOX Telcom

Was too early trying to buy the break of this major inflection point. So far formed a double bottom vs $83 which is a major line in the sand. Below $83 should see a retest of those $76 lows. $92 still the real area to be adding through for a move back to highs.
The New Big Picture Set Up
The Big Picture CVX $160+ 12 Month Price Target

We made a mistake when we were focusing on the energy sector and that was focusing on XOM sure chart wise it was a great value play and had the smallest amount of risk from our entry the overall headwinds were still south.
Yet the leader CVX received much more love. So far we can see how there's two key areas we want to watch, $120 and $134 while the real line in the sand has been above $100 in CVX for going back as far as October 2016.
If Energy continues its overall weakness as it hovers near support of its wedge, we want to keep an eye on CVX to see if it can hold up vs $100. If it can great signs where we can start small and add through levels. This will be a patient one. Remember this is a heavy thick oil name, not a light and wide bio tech.
Entry $120.05
Stop $99.89
Big Picture Target $160+
The Big Picture's Updated
The Big Picture WVE $80+ 12 Month Price Target
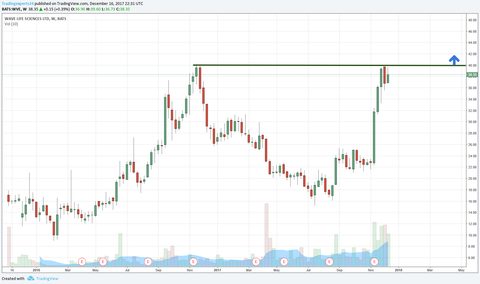
WVE is a recent new issue biotech, as we have seen this name has been a beast this past month and showing its hand that $40 is still the major level (2nd time retesting it) where we can expect the sellers who were trapped from the first go around to take stock off for as close to break even as possible.

Been battling with this $40 level for a while now and started to finally poke its head out closing strong going into the close on Friday. Above $42 is all new price discovery. In a name like this $1 stop might seem tight, however given the current market environment and how thin this fuckers can get it. I am in more defense mode than offense. Will add through $42 vs the same stop.
Triggered $40.01
Stop $38.89
Big Picture Target $80+
AXDX $60+ 12 Month Price Target

AXDX has been setting up for over 22 years, shit this set up has been setting up for longer than some of our members have ever been on this earth for. Above $30 is all new price discovery.

As we can see this $30 has been battling this $30 7 times in the last 4 years. Recently the buyers are starting to step up to give us a tighter entry.

AXDX is a prime example of why we want to keep WVE tight, triggered $30 and dropped a quick $8. We took the smallest paper cut in it, and I started a feeler position after it flushed $23 and bought back up through $24.
Entry 30.01
Stop TBA
Big Picture Target $60+
ALNY $280+ 12 Month Price Target
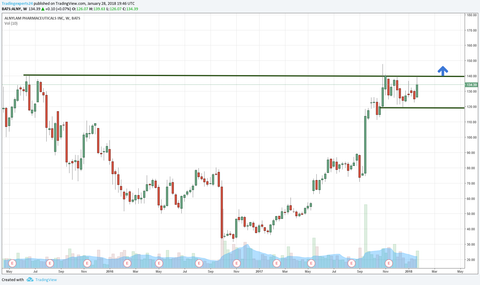
ALNY has been setting up for this $140 level for quite some time now, which looks somewhat similar to ENTA a prior Big Picture Idea that's up 50% in 8 weeks. Now will it trade exactly like ENTA?
Probably not, however chart wise we know $140 is the level that we need to be in for.

ENTA took around 2 months near highs before going, ALNY has been flagging in this $20 range for 3 months now.

After ALNY gapped down under $120 and started to get bought back up, added vs the LOD, after the small bounce was keeping an eye on $124 to add. Took a breakeven loss in it. Will look to buy back above $124 to start a position and than will be adding through $140 in time.
Feeler $124.05
Big Picture Entry 140.01
Stop $107.89
Big Picture Target $280+
WDAY $200+ 12 Month Price Target

WDAY $116 was too early as we saw, will be on the look out for the sneaky buy back for the 4th attempt through that level.
Entry $116.01
Stop TBA
Big Picture Target $200+
KO $60+ 12 Month Price Target


KO has been flagging for quite some time around this $46.50/$47 area with consumer staples like KO flagging near highs other than WMT $100, this is probably one of the best places to be in this space. KO took out its major $44 level that was its high for 20 god damn years. Big picture wise through this area vs $44 is showing us it is risk worth putting on. Remember it took this name 20 god damn years to get back to this price, this name will require zen like patience, put the risk on, set your stop and let it work.
We man handled KO for 9 days in a row and avoided all of the pain. Right now KO seems to be a tight box between $45.50 and $42.50 half, still peeping that $40 area in time if given the chance.
Triggered TBA
Stop TBA
Big Picture Target $60+
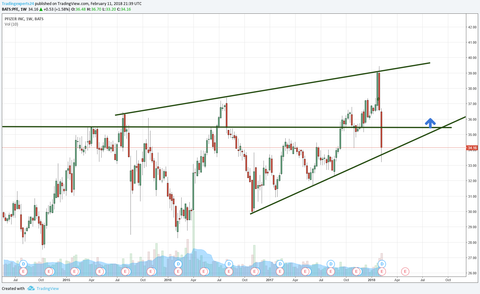
PFE $50+ 12 Month Price Target
PFE is more in the value camp in the healthcare sector than the fast bio's were use to, however we are starting to see some rotation to these value names near major level like INTC that was good for a 26% move in a month through $38. PFE is setting up around this $37.50 area it recently made an attempt for it however didnt have the juice. For now will be keeping an eye as it pulls in vs $35. Given its a slow name and each penny counts. I will be looking to buy $37 vs $35.
PFE back near support of this channel however still seems prudent to buy back up instead of trying to catch lows. For now will keep keeping an eye around the $35 area in time.
Entry $35.51
Stop TBA
Big Picture Target $50+
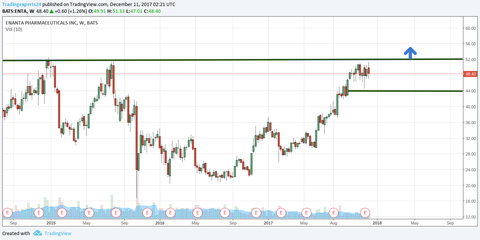
The Big Picture ENTA $84+ 12 Month Price Target
ENTA is a biotech and somewhat of a newer issue that has only been trading for around 4 years. The later part makes it even more appealing, this chart reminds me of NBIX $56, ONCE $66 and KITE $95. All of those charts from the Big Picture levels were good for $20+, $30+ and $50+respectively. ENTA is still just chopping around and can easily still shakeout its current short term support around $45. For now we just have to keep alerts and our eyes on that $52.
ENTA exceeded our Big Picture Target of $84 trading as high as $96 after getting extremely parabolic, the weekly trailing stop helps keep most of the meat of this trade. Given the free fall it ha been on, will be keeping an eye on $60.
Triggered $52.01
Stopped out $81.89
Big Picture Target $84+
The Big Picture TIF $132+ 12 Month Price Target
This $97 level in TIF has been resistance for over 16 months now, recently this name has been more emotional than your ex when she finds out that you are dating someone new. $10+/- weekly swings are showing a clear sign that the emotions are high in this one. Just when all the weak hands puke $96ish is when we want to start eyeing it much closer.
Big Picture wise $110 is still huge, for now if $98 breaks we should expect to see a breakdown back into the range that were were trading TIF before the run it went on. If $98 does break will see if there are any chances to pick some stock up in the low $90s.
Next Entry $110.05
Stop TBA
Big Picture Target $132+
The Big Picture LJPC $50+ 12 Month Price Target
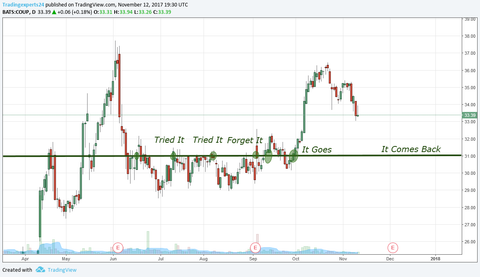
At this point most of us are at odds with LJPC trying to cat this move through $36 and has been wearing the gang out as a whole, which reminds me of COUP which also wore us all out until there was only one member left, Inside George whom caught the easy move as we all sat there with our dicks in our hands, case in point below.
As we can see in COUP, we tried $31, $3 pull in, we try it again $2 pull in, we try it again $1.50 pull in, ahh fuck it, pulls in a $1 and goes and Inside George catches the the 15% move with ease.
LJPC defiantly took us for a ride and shouts to T Fresh for having the balls to take it. Now that it is starting to show us that its ready. If we can get a few days back under $36, we should have an opportunity for that sneaky buy back. If were really stretching here (hopefully the stock gods are listening) if $33 can still hold up would be even better. Lets just not get tooo greedy.

The fire is being put out, now its time to sift through the rubble and find your valuables.