


The Big Picture Outline
- Broad Market Outlook
- Macro Rotation
- Sector Rotation
- Sub Sector Rotation
- New Big Picture Idea
- Updated Big Picture Idea's
____________________________________________________________________
Broad Market Outlook
Very interesting week where on Monday looked like the world was ending and by Friday it was filet for lunch and dinner. Frustrating the shit out of traders, money managers and individual investors who for the most part felt lost without a paddle as the uncertainty of the trade wars continue (the market hates nothing more than uncertainty). Summer trading wise we were gifted probably one of the best summers in years however we are starting to see some red flags that August could continue to be a rocky one.
We are seeing a rising wedge forming in the tech sector with the FAANG stock other than Apple showing us that even the prom queens can fall from grace, now with the market bouncing and looking as if a new high in the Nasdaq is in the cards, one would assume risk on, right? However why is it that all the defensive sectors are ripping? Healthcare is a hair away from retesting pre correction highs, Consumer Staples which was in the dog house all 2018 is now on a tear, Utilities are bull flagging in a range that it has not seen in 2017 and REIT's are also ripping. Smart money is getting defensive as the charts do not lie. Now there are still sectors out there like Materials that are flagging in a tight range and Energy is starting to show its face that it might be ready in time as well.
Individual name wise I will be keeping an eye on DWDP, PX, LYB, APD, IP and NEM that are in the Materials space. Some other names I will be watching RCKT 22, IRWD 20, ATNX 20,BBY 78, INXN 66, FANG 136, and PXD 190.
____________________________________________________________________
Macro Rotation Outlook
Cheat Sheet
Nasdaq tighter upward channel
S&P 500 workings its way to retest highs
Dow Jones grinding towards prior pivot highs
Mid Caps 365 DCA
Small Caps 170 DCA
China holding for now
Japan holding for now
Europe holding for now
Emerging Markets 44 DCA
India sitting on hands
Russia 21.50 DCA
10 Year 3% flagging
Bond's basing
USD cant sleep on 95
Oil $71 support
Nasdaq 8400+ 12 Month Target

Very interesting week to say the least with the little shake and bake that should send us higher in the short term. However as these upward channels get tighter and tighter we need to be willing to put risk on however tight with our exits because when this tide turns it turns quick. Still feel that new 52 week highs and lows are still in the cards for 2018.
SPY 300+ 12 Month Price Target

The SPY has continued to work its way back toward pre correction highs and chart wise the large consolidation its continue to put in this year gives me much more confidence than the new highs the Nasdaq continues to make. As the tech darlings start to show that they are just like everyone else, the rest can follow suit.
Dow Jones 300+ 12 Month Price Target
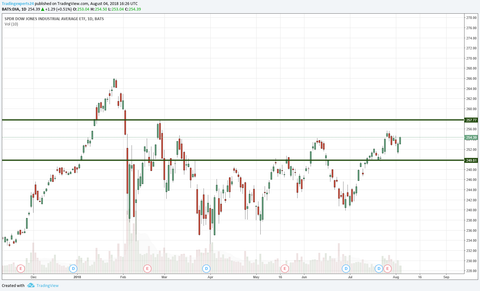
The top 30 are some slow movers as you can start to get the picture when you are holding KO for a week to make 2% or WMT to make 5% in 2 months, now there is nothing wrong with having some cash in these names, sure on the up days you feel like your lagging yet when the market gets taken to the wood shed you'll be kissing the ground you were long KO and not a $20 biotech that just lost 15% of its market value in 12 minutes.
MDY Mid Cap Stocks $400+ 12 Month Target

Mid caps are looking to take over for the small caps as it continues to flag near highs, will be DCA'ing 365.
IWM Small Caps 200+ 12 Month Target

Small caps still flagging under 170 however will need some time.
GXC China +$150 12 Month Target

Was a little early buying stock into the bear flag in China, now when picking up stock near support or lows, its a different game than buying resistance where its much more straight forward, near support you have to except a little red in the waters, still picked some up near $100 and will continue to DCA above $100 vs lows.
EWJ Japan +$85 12 Month Target

Japan had a nice bounce from our last DCA and is starting to form a new range, still sitting on my hands for now.
VGK Europe ETF $82+ 12 Month Target

Europe looking very similar to Japan, our last DCA was pennies off lows and now we will wait for the next actionable add.
VWO Emerging Markets +$58 12 Month Target

Emerging Markets continue to respect this downtrend line to a T, now I fudged up selling stock in India as that downtrend has continue to show its working it way back to highs, when VWO goes, I will be much more patient on the way up. Next DCA 44.
INDA India +$53 12 Month Target

Got a little quick on the trigger taking profits in INDA this week as its showing me to sit, will hold the rest as it works its way back to retesting prior highs.
RSX Russia +$30 12 Month Target

Russia didnt have the same juice as India with its downtrend break, so for now still sitting on my hands and will look to DCA above 21.50 and 22.
10 Year Treasury Note Yielding 2.96%

The 10 year is starting to flag in this 2.7-3% range seems like we will see higher yields in time.
You might start to hear terms like "inverted yield curve" in the media. There is one historic leading indicator that will give us a big red flag that a recession is on the horizon which is an inverted yield curve.
Very simple an inverted yield curve is when the 2 year Treasury Bill pays more than the 10 year Treasury Note.
Right now 10 year Note is yielding 2.95% (higher = good)
Right now the 2 year Bill is yielding 2.64%
BND Bond Market

Bonds basing as it has been as of late, snooze fest.
USD

Dollar has been trying to get out ahead of this $95 area however it might need some time. Remember weak dollar great for US stocks.
OIL

Still just chopping around after the recent pull back, given the energy sectors nice flag yet oil's crappy trading, smells fishy.
Fun fact there is 42 gallons of gas in a barrel of oil which comes out to around $1.88 per gallon. So when your at the pump paying $3-$5 now you know why these countries fight over it so much.
____________________________________________________________________
Sector Rotation
Key points
- For any of the major markets or sectors, we are parking these positions in a taxable account looking to hold for a year plus (Long Term Capital gains)
- Meaning we are willing to hold positions against us as overall sectors and markets are much less volatile than individual names.
- We are buying or adding (dollar cost averaging) when there are actionable set ups.
- We are selling for either profit or getting out for breakeven if better opportunities arise elsewhere in other sectors.
- If you plan to add this strategy to your portfolio please discuss it will me so we can make sure you are not parking these ETF's in retirement accounts locking up tax deferred capital that can be put to better use in individual stocks.
Cheat Sheet
VGT rising wedge
VDE bull flagging
VIS near resistance, looking for consolation
VOX higher low still in macro downtrend
VAW 136 DCA
VCR 176 DCA
VFH 71 DCA
VNQ Retesting prior pivot high
VDC holding
VHT holding
VPU holding
____________________________________________________________________
Sensitive - sectors that have moderate correlations to overall market conditions.
VGT Tech

Tech is forming a rising wedge, which tends to be not the most bullish of signs, as this trend continues to tighten, there can still be days where it pushes through resistance and form new highs to trap the suckers. Given that we saw already a few red flags (FB losing 25% on lower guidance for the 2nd half of 2018, NFLX on the weekly looking as parabolic as bitcoin did at 10k, AMZN who everyone is expecting to be at $5k in a week didn't budge, AAPL was the only one to safe face out of the group) Now granted all these names have been on stupid runs, most up 50,100%+ this year, remember leaders can just as quickly turn to losers. We are seeing some obvious signs that this time is no different than the past when a leader gets chop down to size.


VDE Energy

Energy still flagging and looking strong while Oil chops around, the much larger macro pattern for Energy still has a lot of room to go as this is only the 2nd major flag that is forming, will start to put some risk back on in this sector above 106 or near 102 if given the chance.
VIS Industrial

Industrial's are still in this range, with 144/146 being the upper levels it needs to clear, if we can get some type of pull back I would be much more inclined to add, for now sitting.
VOX Telecom
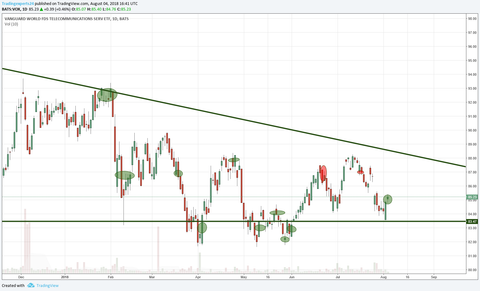
Picked up some VOX last week after it held the gap down to a T where for now it seems that buying $82 is out of the cards (a great sign), now telecom is still in this macro downtrend so it is far from out of the woods however its been in the dog house for 2 years now, so similar to the lesson from Inda when this finally breaks, it will be hands sitting time for a long time.
____________________________________________________________________
Cyclical - sectors that are more sensitive overall market conditions.
VAW Materials

Materials continue to get tighter and tighter where Industrials are banging on resistance no where near a viable out, Materials are flagging tightly, we have already see some good earnings come out of this space and above 136 I will be adding in VAW.
VCR Consumer Discretionary

170 DCA for 3rd times a charm.
VFH Financials

All week I was selling this $71 as it seemed to be continued resistance after the run its been on since last month however seeing it only pull back a $1 and is right back near resistance, could be worth picking some back up on $1 risk at a level of resistance that has been attempted a half dozen plus times.
VNQ REIT

Market rallying with REIT's and Utilities as well, sounds a little fishy to me, remember smart money tends to park cash in these two seconds when they are expecting a weak market.
____________________________________________________________________
Defensive- sectors that tend to outperforming during sub par market conditions.
VDC Consumer Staples

Defensive name ripping towards levels that we have not seen since the beginning of the year. Holding for now.
VHT Healthcare

Defensive name ripping to pre correction high, a sign to take note of.
VPU Utilities

Utilities flagging while the market has looked strong the last few days, another red flag to take note of.
____________________________________________________________________
Sub Sector Rotation
Cheat Sheet
WOOD 76 DCA
IHE working its way to retest pre correction high
IBB 120 flag forming
XT 38.50 DCA
WOOD

Wood is giving us a nice 76 DCA on tight risk.
IHE Pharmaceutical

Missed the second leg in IHE as it works it ways back to pre corrections highs.
IBB Bio Tech

IBB starting to set up under 120, needs some time.
XT Exponential Tech

XT has been working on retesting that 38.50 high, will look to add when it can.
____________________________________________________________________
The New Big Picture Set Up
The Big Picture AXDX $48+ 12 Month Price Target

AXDX is a healthcare and medical equipment company that has been a name we have trade a few times on this $30 breakout as you can see from the weekly this $30 level has been setting up for 4 years.

Now I have tried this name a few times, buying $30 for a paper cut, trying it near lows to get shaken out a few times and caught one little trade that was good for 9%, now its still in a 10% range so its not ready to throw a ton of capital at however to start DCA'ing above $22 and $23 could be good starter positions to get ready for that $30 break down the road.
Big Picture $30.05
DCA $22.05 / $23.05
Stop $19.95
Big Picture Target $48+
____________________________________________________________________
The Big Picture's Updated
The Big Picture COHU $34+ 12 Month Price Target

Cohu is a semiconductor that has been setting up at this 26 level, recently I have been keeping a close eye on this $26 level and was too early recently however after the recent pull in, its giving us a lower risk spot to DCA. Will continue to add above $26. Reminder earnings are on 8/2.

With an earnings beat out of the way added to COHU through the big picture entry of $26.05
Big Picture $26.05
DCA $26.05
Stop $24.45
Big Picture Target $34+
The Big Picture STX $75+ 12 Month Price Target

STX has been setting up for this soft level at $60 for a few months now since we will be DCA'ing into it we will be giving the first DCA $6 worth of room so we dont LULU ourselves for months before it finally goes.

STX still needs some time however will be giving us a decent DCA in time.
Big Picture $60.05
DCA $56.05
Stop $54.89
Big Picture Target $75+
The Big Picture AFL $60+ 12 Month Price Target

This $46 level in AFL has been setting up all year and as of late it is handing us the tightest risk entry as possible, now sure the real out is $1.50 lower however we are seeing how we can sneak in on less than $.50 risk.

As AFL ran into a prior level of resistance took some profits and with the rest of the stock will give it the room needed to get out of this range and break higher.
DCA $43.55
Big Picture Entry $46.05
Stop $44.45
Big Picture Target $60+
____________________________________________________________________


발기부전 남자 정력제 구매
발기부전
발기부전 You’ve gotten 남자 정력제 구매남성 발기부전 치료제 구입 the most effective 발기부전 – http://korea-via.com/ – online
websites.