


The Big Picture Outline
- Broad Market Outlook
- Macro Rotation
- Sector Rotation
- Sub Sector Rotation
- New Big Picture Idea
- Updated Big Picture Idea's
____________________________________________________________________
Broad Market Outlook
We saw this past week the major markets tick new highs however there was not many fireworks going off on this surprising news as we are halfway through summer. Mid caps are starting to show its hand that it might just be ready to break out of these highs sooner than later. Now as we climb back to new highs or near highs in the major markets, one has to remember that in range bound markets such as the one we have been in all of 2018. When things look great, get defensive and when things look like shit get ready to go shopping.
If you go back and study prior corrections there has been times when new highs were retested (euphoria) was followed by max pessimism as new lows followed (in time eventually those highs were taken out). The picture that we posted later in the week of the SPY weighting showed just that, with only 5 companies covering half the weighting of an index of 500 stocks, a few bad days in just a hand full of leaders could make overall markets look like shit when that's not really the case (hence why we trade stocks and not the SPY).
Globally still adding to China and Emerging Markets as they are both presenting the best value buys compared to the domestic markets in our backyard. Sector wise we are seeing how Materials and Financials are looking the best as they have lagged some what compared to the more over inflated sectors such as Healthcare, Utilities, and Consumer Discretionary.
Stock wise there are still plenty of money to be made out there however this is a tight risk time, this is not a time to give names more room then needed. If your in a profitable swing day 2,3, cannot lose a penny in it no matter what.
Observing everyone in Alpha, I have started to notice a subtle trend of the traders with hand written goals of either $ or % gains have been out performing, the traders who have not been doing so. If you have some goals set, PM me the goals or if you need help setting a few goals let me know and we will set some with dates of when you want to reach them by. As a group my goal is to see the Alpha chat locks in at least $100,000 before we head to Turks to play with some pups!
____________________________________________________________________
Macro Rotation Outlook
Cheat Sheet
Nasdaq upper end of range, tight stops
S&P 500 278 line in the sand
Dow Jones retesting prior pivot high
Mid Caps 365 DCA
Small Caps giving space
China 104 DCA*
Japan 58.55 DCA
Europe 57.55 DCA
Emerging Markets 43 DCA*
India 34.55 DCA
Russia holding
10 Year 3% flagging
USD cant sleep on 95
Oil $71 support
Nasdaq 8400+ 12 Month Target

Nasdaq continues to lead the overall markets higher and the overall theme has been when it looks great sell it and when it looks like shit get back in.
SPY 300+ 12 Month Price Target

The SPY has been putting in great higher lows to grind back towards the retest of the pre correction highs, however if you look back and study prior corrections at max euphoria is often followed by max pessimism (retesting lows), will this time be different, probably not, for now above $278 were chilling (for now).
Dow Jones 300+ 12 Month Price Target

The Dow retested a prior pivot high area and similar story as the rest, when they look perfect up your stops before the rug pull occurs.
MDY Mid Cap Stocks $400+ 12 Month Target

The Mid Caps have been setting up chart wise in much better shape flagging near highs after retesting the pre correction highs, DCA'd back in last week and will look to continue to add through highs vs $360.
IWM Small Caps 200+ 12 Month Target

Small caps had lead the mid and large caps for most of the year being the first to take out pre correction highs and showing us what can be in store for the other caps, however for now it seems the small caps are in sleep mode which is fine, let them digest the run they've been on and well catch the next leg when it presents itself.
GXC China +$150 12 Month Target

Domestically vs globally, I have been taking most of my gains out of the markets here big picture wise and rotating into China, Japan, Russia, Europe and the Emerging Markets. I will be DCA'ing in China above $104.
EWJ Japan +$85 12 Month Target

Japan still needs some time however one could add above $58.50.
VGK Europe ETF $82+ 12 Month Target
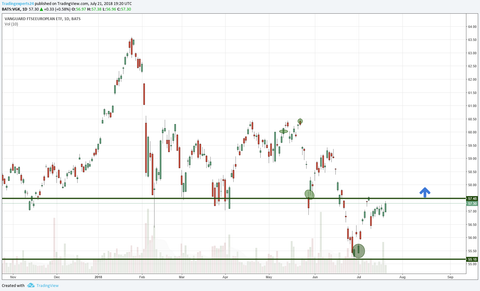
Europe is setting up for a DCA above $57.50 however the emerging markets are showing a better bang for your buck.
VWO Emerging Markets +$58 12 Month Target

Emerging Markets have been in an obvious downtrend for sometime and most importantly shook out a major level in the beginning of July, eventually this downtrend break should be one to send it back to highs in time. Will DCA $43.
INDA India +$53 12 Month Target

India is showing us similar to what one could expect from VWO, the break of the downtrend, the retest of said downtrend, than the slow grind to make its way back to highs, the next DCA will be $34.55.
RSX Russia +$30 12 Month Target

Russia also showing us the downtrend break we are expecting in VWO however the pull backs are never fund, just have to give them time and add on the way up, no sense in trying to be a hero catching lows.
10 Year Treasury Note Yielding 2.90%

The 10 year is starting to flag in this 2.7-3% range seems like we will see higher yields in time.
You might start to hear terms like "inverted yield curve" in the media. There is one historic leading indicator that will give us a big red flag that a recession is on the horizon which is an inverted yield curve.
Very simple an inverted yield curve is when the 2 year Treasury Bill pays more than the 10 year Treasury Note.
Right now 10 year Note is yielding 2.90% (higher = good)
Right now the 2 year Bill is yielding 2.59%
USD

Dollar has been trying to get out ahead of this $95 area however it might need some time. Remember weak dollar great for US stocks.
OIL

$71 is holding its line in the sand for now, either the bargain buy of the year or the foolish errand, for now best bet seems to give oil some time to show its hand as that $74 level is going anywhere anytime soon.
Fun fact there is 42 gallons of gas in a barrel of oil which comes out to around $1.88 per gallon. So when your at the pump paying $3-$5 now you know why these countries fight over it so much.
____________________________________________________________________
Sector Rotation
Key points
- For any of the major markets or sectors, we are parking these positions in a taxable account looking to hold for a year plus (Long Term Capital gains)
- Meaning we are willing to hold positions against us as overall sectors and markets are much less volatile than individual names.
- We are buying or adding (dollar cost averaging) when there are actionable set ups.
- We are selling for either profit or getting out for breakeven if better opportunities arise elsewhere in other sectors.
- If you plan to add this strategy to your portfolio please discuss it will me so we can make sure you are not parking these ETF's in retirement accounts locking up tax deferred capital that can be put to better use in individual stocks.
Cheat Sheet
VGT tight stops
VDE needs time/shakeout
VIS holding
VOX pulling back
VAW 134 DCA*
VCR double top
VFH 71 DCA
VNQ avoiding
VDC 138 DCA
VHT tight stops
VPU needs time
____________________________________________________________________
Sensitive - sectors that have moderate correlations to overall market conditions.
VGT Tech

Tickling new highs with no momo, would not be too surprised to see tech pull in a bit before a real break of 190.
VDE Energy
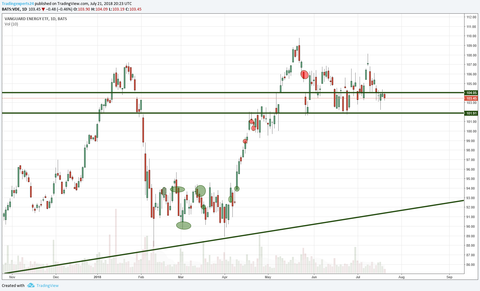
With oil pulling back to its recent support level time will tell if VDE can hold $102, if we are expecting a strong break of $110 a shakeout will be needed.
VIS Industrial

We got some great DCA's buying VIS into pain for the last few months, time will tell if 144 is ready to break this time, for now just sitting on my hands.
VOX Telecom

Selling stock at $87 so far has paid off now we will see if $84 will hold up, for now waiting to see the dust settle before picking some back up.
____________________________________________________________________
Cyclical - sectors that are more sensitive overall market conditions.
VAW Materials

Materials out of all the sectors so far seems to be showing us the best bang for our buck, 134 has been a battle ground a mind boggling 13 plus times this year, each time putting in for the most part higher lows. Will be DCA'ing 134.
VCR Consumer Discretionary

Consumer Discretionary right back to prior highs however we know this song and dance, needs time.
VFH Financials
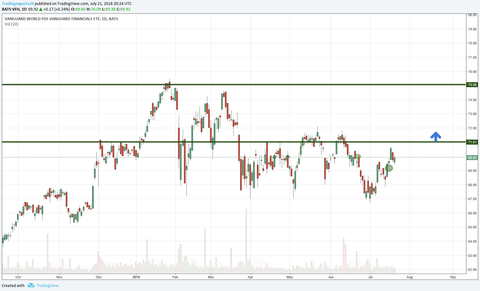
Financials seem to be the sector for the quarter ahead that could be taking over as the leader if Materials don't. Earnings have been strong and even the bank name I hate the most (BAC) is setting up. Chart wise VFH has been setting up in a range where a break of 71 should send it back to prior highs. Will be willing to DCA 71.
VNQ REIT

Lighten up last month and missed the last leg however seems as if the tide is turning and that we are about to see a little more red in the waters than before which is fine when your will to pick some back up.
____________________________________________________________________
Defensive- sectors that tend to outperforming during sub par market conditions.
VDC Consumer Staples

Took some profits in my lower cost DCA's this week however staples came right back, not wildly eager to buy back 138 given I just took profits 2 days ago, if it wants to go (great bc I still have a position) if it wants to chill and give us a chance to get back in, all for it.
VHT Healthcare

Healthcare has been on a tear and purely from a vaca trade stand point missed the last buy back, for now little to rich for my blood, any pull back into the 160s and I'll keep a closer eye on a buy back.
VPU Utilities

Had a nice chop in the most boring sector out there, needs more time to set up.
____________________________________________________________________


Sub Sector Rotation
Cheat Sheet
WOOD 76 DCA
IHE 160 needs time
IBB waiting on 3rd times a charm
XT waiting on 3rd times a charm
BND basing
WOOD
Get taken to the woodshed on this one, 76 DCA.
IHE Pharmaceutical
160 will need some time.
IBB Bio Tech
Waiting on 3rd times a charm.
XT Exponential Tech
XT heading back to retest $38 however 3rd times a charm.
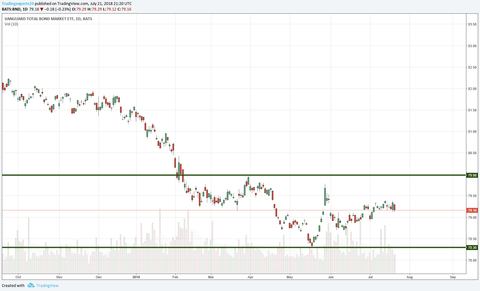
BND Bond Market
Still basing
____________________________________________________________________
The New Big Picture Set Up
The Big Picture CTMX $44+ 12 Month Price Target
CTMX is a recent issue biotech that we have trade back in the beginning of 2018, after the 3rd times a charm went on a monster move. After the 40% run it has came back to this prior breakout level, showing its hand for a sneaky buy back. Now this will not be as easy of a trade as the first go around as there are plenty of people who are trapped with shit prices. However if we can get a strong move above $25/$26 a retest of the prior highs is in the cards than an eventual move through highs.
Big Picture $26.05
DCA $25.05
Stop $21.89
Big Picture Target $44+
____________________________________________________________________
The Big Picture's Updated
The Big Picture BK $66+ 12 Month Price Target
As we mentioned earlier that we are keeping an eye on the fin names, BK a name that we traded earlier this year has came back into an area of support where it could be presenting a sneaking buy back to get in ahead of that major $58 level. $54.50/$55 are much more important levels however when we are DCA'ing we want to find spots where we can put on tight risk adds and be willing to give them room.
Talk about a round trip, great day 2 action than earnings came in with a big fat nope! Power of breakeven stops, lost nothing in this trade and have no problem getting back in, however given the price action lower prices seem in store for now.
Big Picture $58.05
DCA $54.05, $54.55, $55.05
Stop TBD
Big Picture Target $75+
The Big Picture STX $75+ 12 Month Price Target
STX has been setting up for this soft level at $60 for a few months now since we will be DCA'ing into it we will be giving the first DCA $6 worth of room so we dont LULU ourselves for months before it finally goes.
STX still needs some time however will be giving us a decent DCA in time.
Big Picture $60.05
DCA $58.05
Stop $54.89
Big Picture Target $75+
The Big Picture AFL $60+ 12 Month Price Target
This $46 level in AFL has been setting up all year and as of late it is handing us the tightest risk entry as possible, now sure the real out is $1.50 lower however we are seeing how we can sneak in on less than $.50 risk.
Took a small paper cut in it last week and picked up some stock at $43 this week, real spot is $43.55, earnings in a few days so best to give it some time.
DCA $43.55
Big Picture Entry $46.05
Stop $41.89
Big Picture Target $60+
____________________________________________________________________


Truly when someone doesn’t know afterward its up to other viewers that they will assist, so here it takes place. https://www.debossedwristbands.xyz