The Big Picture Outline
- Broad Market Outlook
- Macro Rotation
- Sector Rotation
- Sub Sector Rotation
- New Big Picture Idea
- Updated Big Picture Idea's
____________________________________________________________________
Broad Market Outlook
What a difference in the outlook from week to week, last week was expecting more pain in store however the market said nope. Globally have been putting a great weight over seas, taking profits in our back yard and putting the funds to work in China, India, Japan, Russia, Europe and the Emerging Markets. Chart wise here, the Mid Cap space looks primed to follow the Small Caps in there recent breakout however it seems the Mid Caps might need a few more months to really set up. Dow Spy and Nasdaq all seem for now to be somewhat range bound, hence the focus overseas.
Sector wise we went from last week which was more profit taking and patience while the week ahead there seems to be available as the sectors started to show some more definable bases and sneaky buy backs. Some of the profit taking last week currently looks somewhat premature as Utilities and REIT's have continued to show that even the most boring people can win prom king and queen.
Stock wise the market is showing us that there are still spots that are hot and the numbers do not lie, big ups to John for making almost $20,000 on Friday and to Adam Rav who made over $150,000 in 8 hours which is more than most people make in a year. Never forget that you want to strive to be a loyal trader, not a faithful one. Be loyal to the process of doing the required research to find the next LULU or DBX, forget being faithful to that stock that you want to breakout, yet its showing you that there is some red behind the curtains. Remember during the summer sessions charts more and trade less. We are starting to see more and more of the real strength coming later in the day while the morning tends to be filled with shakeouts. Stop wise aim to up them later in the day to avoid the early morning shakeouts.
____________________________________________________________________
Macro Rotation Outlook
Cheat Sheet
Nasdaq flagging, range bound
S&P 500 flagging 280 level
Dow Jones basing 248 level
Mid Caps 364 3rd times a charm, 4th,5th time tends to be the real charm
Small Caps forming new $10 range
Japan 58 DCA
Europe above 57 a good sign
Emerging Markets 43 DCA
China 104 DCA
India 33.55 DCA
Russia 22 battle ground 24 ATH
10 Year 3% flagging
USD cant sleep on 95
Oil retest 80 will need time to take that out
Nasdaq 8400+ 12 Month Target

Was expecting more of a pull back however when you are wrong you need to realize it quickly and adapt. We can see that Nasdaq is holding the 7,000 area, we should expect it to trade in this range where a potential flag could start to form.
SPY 300+ 12 Month Price Target

As we continue to get into summer trading, there tends to be less news to move the markets, could expect us to stay in this range where we have some very definable levels. As long as we are above 268 we are all good while we continue to battle with that 280 level of resistance.
Dow Jones 300+ 12 Month Price Target

As we can see all of the major markets are tightening up and forming definable bases, which gives us clear lines in the sand of areas to add above and areas to lighten up on the way down.
MDY Mid Cap Stocks $400+ 12 Month Target

If this is not the most text book chart pattern out there, now as we know with major markets they tend to take longer to resolve than an individual stock. Given this index some time and we will be begging to buy $365.
IWM Small Caps 200+ 12 Month Target

Great trade in the small cap space now we need to give her some time to set up where it makes sense to get back in.
EWJ Japan +$85 12 Month Target

Japan has pulled back quite a bit and you can see why we DCA, $57.50 has been an area of support all year and now its finally below it, so for now will look to add above $58 when it can get above what will now become a resistance level. Could expect further downside if there is not a real fight to get back above that $57.50.
VGK Europe ETF $82+ 12 Month Target

Got a sick DCA down at $55 now will wait to see if Europe wants to stay in this range as its poking its head back into what was support all year, time will tell if it starts to become resistance or wants to blow through it. For now holding.
GXC China +$150 12 Month Target

Like Europe, have been buying down here near prior support levels, could it still head lower? Sure, however down here can get low risk stock if $117 is going to set up down the road.
VWO Emerging Markets +$58 12 Month Target

Picked up some more in the emerging market space however as we can see it still needs some time to take out this overall downtrend.
INDA India +$53 12 Month Target

With the broad US markets extended relative to the rest of the globe as you can see we have been putting our money to work in other countries. Got a sick DCA on the retest of the prior low, next area will look to add above $33.50 which has been a major inflection point for India.
RSX Russia +$30 12 Month Target

Last three DCA's all profitable and now we should expect to see Russia battle with $22 before it can attempt to retest the $24 highs.
10 Year Treasury Note Yielding 2.83%

The 10 year is starting to flag in this 2.7-3% range seems like we will see higher yields in time.
You might start to hear terms like "inverted yield curve" in the media. There is one historic leading indicator that will give us a big red flag that a recession is on the horizon which is an inverted yield curve.
Very simple an inverted yield curve is when the 2 year Treasury Bill pays more than the 10 year Treasury Note.
Right now 10 year Note is yielding 2.83% (higher = good)
Right now the 2 year Bill is yielding 2.54%
USD

Dollar has been trying to get out ahead of this $95 area however it might need some time. Remember weak dollar great for US stocks.
OIL

Oil has been flagging between $72 to $80 a barrel, you might start hearing chatter about the Aramco IPO which is slatted to be the largest IPO in history, however MBS is as smart money as they come. He will wait until Oil continues to tick higher, when that IPO does come out, best believe that will be the peak of oil prices for the foreseeable future.

Fun fact there is 42 gallons of gas in a barrel of oil which comes out to around $1.88 per gallon. So when your at the pump paying $3-$5 now you know why these countries fight over it so much.
____________________________________________________________________
Sector Rotation
Key points
- For any of the major markets or sectors, we are parking these positions in a taxable account looking to hold for a year plus (Long Term Capital gains)
- Meaning we are willing to hold positions against us as overall sectors and markets are much less volatile than individual names.
- We are buying or adding (dollar cost averaging) when there are actionable set ups.
- We are selling for either profit or getting out for breakeven if better opportunities arise elsewhere in other sectors.
- If you plan to add this strategy to your portfolio please discuss it will me so we can make sure you are not parking these ETF's in retirement accounts locking up tax deferred capital that can be put to better use in individual stocks.
Cheat Sheet
VDE 107 DCA
VGT 190 DCA in time
VIS holding
VCR 172 Sneaky Buy Back DCA
VAW 134 DCA
VHT looks great, needs time for DCA
VFH 69 DCA
VPU grinding higher, hold vs 115 for now
VNQ hold vs 80, 86 major level
VOX 88/90 levels
VDC support 132, resistance 138
VDE Energy

VDE starting to flag as it based earlier in the year, as we know this sector can flag for a bit, for now will wait to DCA 107.
VGT Tech

Tech looks great as it continues to form higher lowers and fight its way back to highs, however will give it time before looking to DCA 190
VIS Industrial

Started to DCA as VIS started to pull in vs the prior support area. So far it started to form a higher low and seems as if it wants to turn and head higher (since I am long) however it could still easily shake and take out a new low. For now will hold and avoid any DCA until there is a more definable add.
VCR Consumer Discretionary

Was selling $172 a short few weeks ago, now we see that after pulling in after the monster run it went on, it wants to hold up near highs and give us a sneaky buy back.
VAW Materials

We gave Materials some time and now we are starting to see a base starting to form where we can add above 134 in time.
VHT Healthcare

When you spend the week at the beach you are bound to miss a buy back and in healthcare I am now flat footed on the next DCA, will have to give it time before I can find a spot to get in where it makes sense.
VFH Financial

As of late financials have been weak as f as we can see it continuing to retest support, now given the market has been starting to show its hand slightly that maybe we are not in store for a boring summer, if that is the case and financials look so shitty could be a spot to pick up great stock. For now I will let the stock do the talking, above 69 DCA.
VPU Utility

Sold too soon is a statement often quoted when selling a winner when the usually answer is to hold longer. Missed the second leg, not losing sleep over it.
VNQ REIT

Marching its way back to that major major 86 level, above that we should see 100+ in time.
VOX Telcom

A year and a half downtrend still in the works, keeping an eye on 88/90 to see if this is the time where it starts to change this overall trend.
VDC Consumer Staples

Put in the pivot that we were waiting for after the somewhat vertical run it went on during the end of June. Anything above 132 is fair game and will see how it can take out 138 in time.
____________________________________________________________________


 This DHR has been setting up perfectly to let us sneak into the breakout with the lowest amount of risk, lets take a closer look below.


 DCA $76.05
____________________________________________________________________


Sub Sector Rotation
Cheat Sheet
WOOD 79 DCA
IHE if in hold vs 148
IBB LOD stop
XT eye on 38
BND basing
WOOD

We got some good stock on the pull in on some tight risk, now will DCA above 79.
IHE Pharmaceutical

Flat footed here, will need to give it time before finding another entry.
IBB Bio Tech

Thank BIIB for helping push the bio tech sector out of the range it has been in, if you are still in a LOD stop for some makes sense.
XT Exponential Tech

Got a nice DCA in XT after it retest the prior low this is a time where putting risk on makes sense, the 3rd, 4th,5th time into support tends to be the suckers buy. Will see how XT can take out 38 in time.
BND Bond Market

Still basing, wake me up when it is near 80.
____________________________________________________________________
The New Big Picture Set Up
____________________________________________________________________
The Big Picture's Updated
The Big Picture MDT $106+ 12 Month Price Target

MDT is a medical equipment distributor and as one could tell the healthcare sector has been a smart place to be in, for the last two years MDT has been setting up for this $89 level. Now lets take a closer look where we can DCA.

After the recent shakeout/test of $84 and seeing the buyers come right back was a great sign and as a result picked up some stock on Friday. Had a $87.05 buy stop in to add more, HOD was $87.03 which I was glad that I did not have to top tick the name on the day of my first add. Will look to add $87 vs that $84 area. This set up like LULU could still take months, need time and space. Down the road have a feeling that we will have that LULU feeling of why were we not giving it more room and letting it work.
DCA $87.05
Big Picture Entry $89.05
Stop $83.89
Big Picture Target $106+
The Big Picture ROL $75+ 12 Month Price Target
This $53 has been setting up all quarter and sure it did take it out once on the retest however as of late it has been flagging very tightly in a $1.5 range, whats even better is as of Friday it came very close to the level however just couldn't do it. So if it wants to go Monday, its a tight $.50 trade, if it doesn't who cares, we just want it when it wants to go. Above $54 its all new highs.

ROL has a nice pop to retest those prior highs, however we know how that song tends to end, at this point could up the stop to breakeven because if the stock is really going to go it should continue higher, if not and it is coming back to our price could probably still take out the real out of $51.50.
Big Picture $53.05
Stop $52.89
Big Picture Target $75+
The Big Picture STX $75+ 12 Month Price Target
STX has been setting up for this soft level at $60 for a few months now since we will be DCA'ing into it we will be giving the first DCA $6 worth of room so we dont LULU ourselves for months before it finally goes.

STX is getting tighter in this flag and is showing us that $55 is the line in the sand.
DCA $59.05
Big Picture $60.05
Stop $54.89
Big Picture Target $75+
The Big Picture DHR $130+ 12 Month Price Target

It is showing us $100 is not has hard of a level just yet, however we dont want to simply buy $101 because that's how high it flushed recently.
DCA $100.05
Big Picture $104.05
Stop $97.89
Big Picture Target $130+
The Big Picture AFL $60+ 12 Month Price Target
This $46 level in AFL has been setting up all year and as of late it is handing us the tightest risk entry as possible, now sure the real out is $1.50 lower however we are seeing how we can sneak in on less than $.50 risk.

Picked some up on $.50 risk and will look to add above the highs near this prior support area to have some low risk stock for the $46 level.
DCA $43.60
Big Picture Entry $46.05
Stop $42.45
Big Picture Target $60+
The Big Picture EDIT $100+ 12 Month Price Target
We started to nibble on this EDIT through this recent $38 level however we know $44 is the real level in this somewhat new issue biotech, will be looking to continue to DCA up through $40, $42 and than the Big Picture level of $44.

Picked up some more EDIT through the DCA of $38, for now the real level is $42.
Big Picture Entry $42.02
Stop $33.89
Big Picture Target $100+
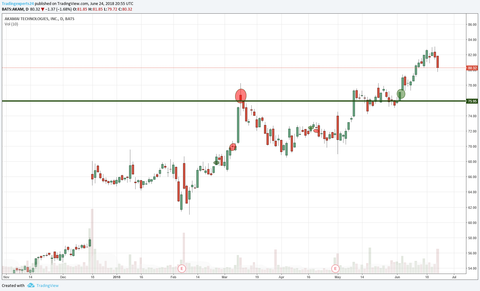
The Big Picture AKAM $150+ 12 Month Price Target
We recently traded AKAM back in Feb/March and caught a nice little chop in it, as of late after a pull it, its marching right back to those $78 highs. Now doesn't this 20 year level look somewhat similar to an old friend of ours?
Remember little $25 NKTR that set up during a similar 20 year level.
In these bigger picture trades a weakness of ours has been holding through the first pull back as we focus on squeezing as much out of each trade, AKAM will be a good test to see if we can weather this pull back and hold for the next leg.

Now normally we would have gotten out below $81/$80 however for myself I have noticed that I was being too greedy on the stop like LULU at $98 vs $100 which at the time looked like we traded it perfectly yet we missed the next leg. For AKAM I wanted to give it the room to hold through the pull in, and bought on the gap down on the 15min rule that looked great however was still a tall ask. So this trade didnt work yet it was pretty much just open PnL given back and a small loss. First trade that I can remember being up 5% and losing money in which is a good problem to have. Chart wise we can't ENTA $51 this name, back through $76 we need to be involved.
Big Picture Target $130+
Next Trading Experts Retreat has been selected!
Turks and Caicos
Airport Ticker PLS
Dates August 9th to the 12th
Thursday to Sunday
Cost will be $1398 if paid in full by end of July
Cost will be $1498 if paid by August 9th
So far the Turks crew will be Shake, myself, Rob, JD, Kriss, Gina, Carl, Max and John Mendez!
15 Alpha's attending we will be chartering a 100 foot yacht for the day!
30 Alpha's attending and we will be renting a 20,000 sq foot villa
Any questions please let me know