The Big Picture

 
The Big Picture starts with the Broad Market Outlook, than we dive into Sector Rotation, than get into the new Big Picture Idea of the week as well as an update to each prior Big Picture Idea. To view a bigger version of each chart just click on the image.
 
Broad Market Outlook
 
Big news of the week was the tax bill getting passed as a result corporate tax rates will be lowered from the mid 30%'s down to 20% as a result small and mid cap companies should benefit the best from an earnings perspective.
 
Sector wise we saw REIT's get smoked after trapping anyone who tried to buy that $86 breakout in VNQ. Utilities were also one of the worst sectors of the week due to the wildfires out in Cali, both sectors we have virtually zero exposure to. Golf clap for the group. The sector that was in plan and starting to wake back up again are the energy names as we saw CVX breaking out as noted in last week newsletter, and XOM setting up at a major level ($84).
 
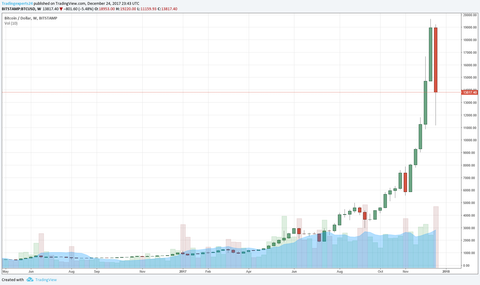
Kills me to even write the word Bitcoin in this newsletter however this is a real world example of a bubble and case study that will be studied for years that we watched first hand. So lets dive in that shitty water for a minute to learn a thing or two about bubbles.
 
Stages of a Bubble
 
Whats a 42% loss between friends in a week ($19,000 to $11,000)?
 
Toward the end of most bubbles there are a few subtle signs one of the major ones are when people start taking our mortgages or home equity lines on there homes to get in. We saw that during the tech bubble, Beanie Baby Mania and during the housing crisis.
 
 
Another subtle sign is when it is started to be advertised as a long term investment and people are given the option to add it to there 401k and other retirement accounts. People were cashing out there 401k's in 2000 to buy stuffed animals as long term investment. Not a few people, we are talking millions. Want to know how many crushed it? A hand full of women in Chicago, while 99% lost there shirt or toys? You get the idea.
 
 
The one good thing for us, is that we can see how solid the overall market is on a percentage basis. From Mach 2009 lows to present day (8+ years), the SPY is only up 285% compared to the 2000% run up in Bitcoin's in 1 year. So when you think the market is high, just realize when you compare it to that type of move. There is plenty left in the tank, let people chase the rabbit while we act like the turtle.
 
 
(Was out to dinner with a friend and client on Friday)
 
Your going to be mad Bennett
 
I know, you bought Bitcoin
 
I finally got in on Wednesday!
 
You know its crashing right?
 
I wont sell it 
 
You cant, coinbase wont let you
 
Its only a little bit of money, who cares?
 
That's rationalizing a loser
 
I'll just get out when I breakeven
 
And its gone


SPY $3,000+ 12 Month Price Target 
You might be starting to become aware that the market climbs on a Wall of Worry,
 
"the market is too high!"
"It has to pull back"
 
Why does it though? Really ask yourself what about the market is too high? Your personally opinion or fact?
 
On the way down, stocks or markets cling to the Slope of Hope,
 
"the market will turn"
"this pull back sucks, it will turn soon!"
 
Currently we are in the upper range of this channel of this year long breakout, broad outlook is still higher however being much tighter with stops because we can very easily retest 255.
 
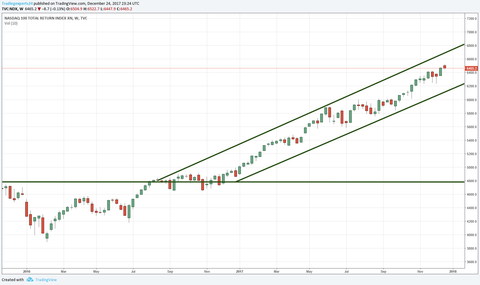
Nasdaq $8400+ 12 Month Target
We have all seen how tech has been has been one of the leaders this past year however it seems for the year ahead there has been whisper of smart money moving some risk off the tables in there winners (tech) and focusing more on weaker sectors (cue up The Secret for the lesson on re balancing). In short they sell some of their winners (realizing the gain) using that money to add to the under performing assets. Broad outlook we have plenty of lines in the sand to keep an eye out for 6,200 short term, 6,000 medium term, we stay above those we should continue the rise to 8,000+.
 
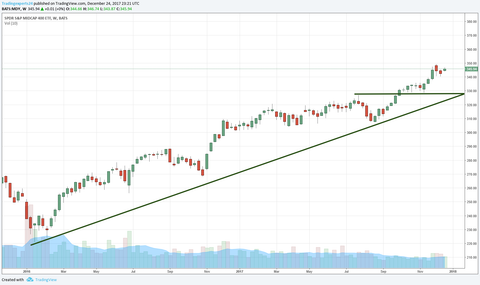
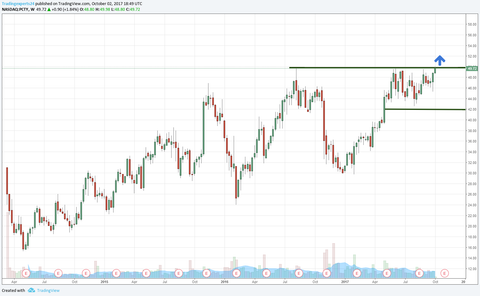
MDY S&P Mid Cap Stocks $400+ 12 Month Target
Mid Cap stocks recently just broke out to new all time highs, there is no real resistance until the 400 psychological level. Short term above 330 all gravy, 300 is the real line in the sand. We should see a boast in earnings in mid and small cap companies thanks to the lowering of corporate tax from the mid 30% down to 20%.
 
IWM Small Caps $200+ 12 Month Target
Small caps should perform very well this year with the lowering of corporate tax rates from the mid 30%'s down to 20%, line in the sand is $144 above it (good).
 
 
Sector Rotation
 
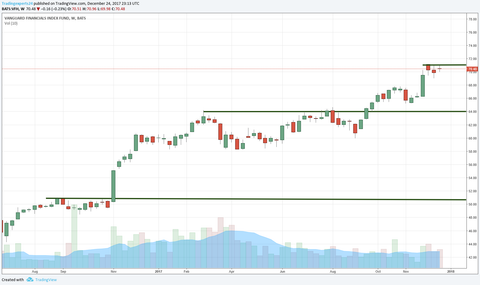
VFH Financial Sector 
Most financial names came along way this year, tightest flag through $71 vs $69, would be keeping stops very tight if still holding any of the banks. Flag after flag they tend to get tighter and tighter towards the end of the overall move.
 
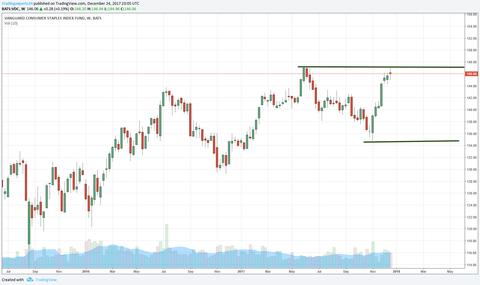
VCR Consumer Discretionary
Consumer discretionary came a long long way since its breakout in mid November, would be keeping stops very tight vs $156.
 
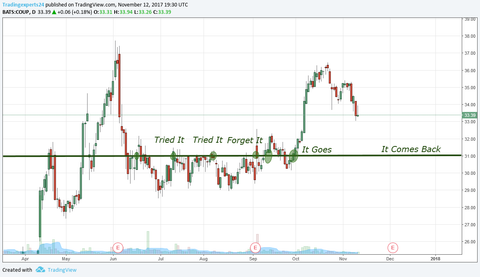
VDC Consumer Staples
Consumer staples retesting the $147 level however this is the 2nd retest where we tend to see some selling pressure from the investors who were trapped getting long near this same level back in May, should expect some what of a pull in and will look to get long above $147 after the 3rd major attempt at that level.
 
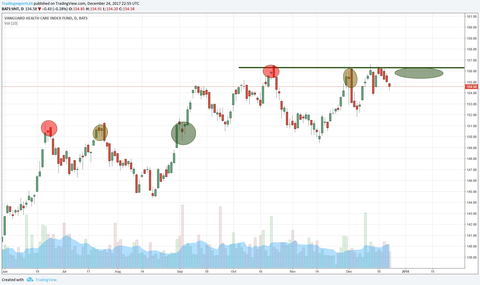
VHT Healthcare Sector 
The Healthcare sector having healthy pull back, key level to keep an eye on is $156, anything vs $149 is far game.
 
 VGT Tech Sector
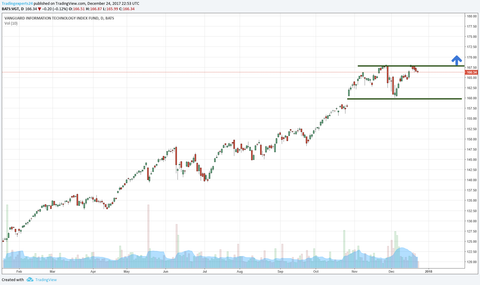
The tech sector, if it aint broke dont fix it. Tech is flagging at highs, key level to see break is $168, if your still in tech, could be a spot to put risk on through that level, below $160 would be the line in the sand to lighten the load.
 
 VDE Energy Sector
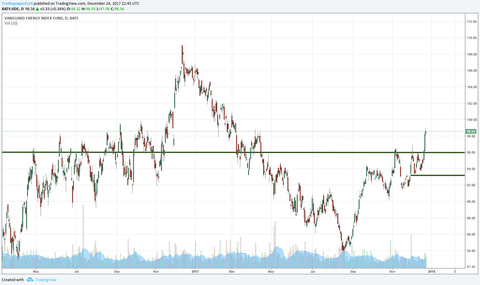
The energy sector broke out this week, with CVX leading the charge after breaking out of a nice flag and has its sights on its prior highs ($135), seems smart money is starting to show some love to this sector, XOM also setting up which has been a laggard all year, through $84/$85 we should see a move back to highs ($95). Next major level in VDE to keep an eye out for is $100, anything vs $93 is all par for the course.
 
VNQ REIT Sector
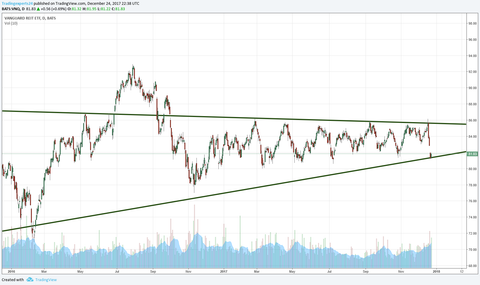
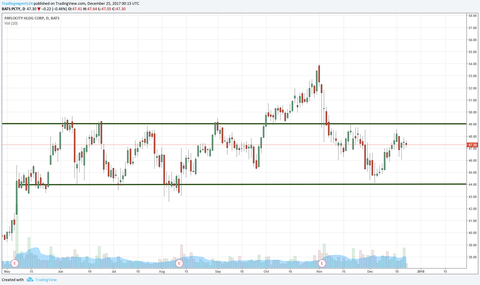
The REIT sector sold off this week due to the Tax Bill getting passed, there have been major cuts to what home owners can deduct off their mortgage interest and property taxes, as a result we saw VNQ tickle that $86 prior to the bill getting passed and than very abruptly get smoked back near support of this wedge. Short term should except some more selling pressure due to the uncertainty of the future tax implantation.
The REIT's that will be hurt the most will be ones whose investment properties are based on the east or west coast (where property taxes and home values are the highest), this would be the time to go hunting for REIT's that have there investment properties in central US (where they will not be as effected by the tax changes) that have been getting smoked due to the head line risk only if you can weather the volatility. In VNQ will look to nibble up through the gap fill $82 vs $81 to be in for the $86 break in time.  
 
VPU Utility Sector
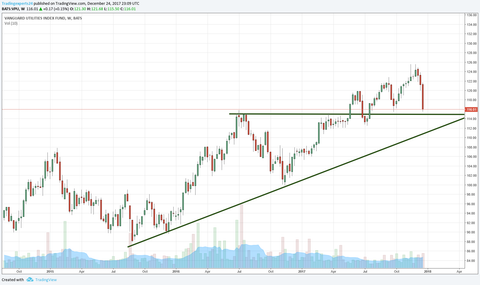
The utility sector was by far the worst performing sector this week, most selling off due to the headline news of the fires in Cali, sector wise it tends to be a good sign when utilities sell off since smart money tends to park there money in this sector during times of uncertainty. If they are pulling out, the money should follow into a new sector as we saw with energy this week. VPU has been defending $112 for quite some time, would like to see if it can still hold that line in the sand.
 
VGK Europe ETF  
VGK, Europe, starting to tickle the $59 level anything vs $57 is far game for a move back to highs.
 
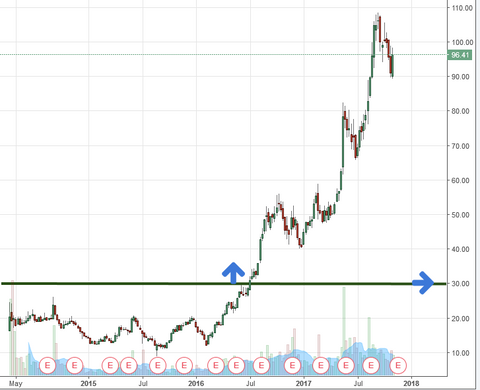
The New Big Picture Set Up
 
 The Big Picture PFE $50+ 12 Month Price Target
PFE is more in the value camp in the healthcare sector than the fast bio's were use to, however we are starting to see some rotation to these value names near major level like INTC that was good for a 26% move in a month through $38. PFE is setting up around this $37.50 area it recently made an attempt for it however didnt have the juice. For now will be keeping an eye as it pulls in vs $35. Given its a slow name and each penny counts. I will be looking to buy $37 vs $35.
 
Entry $37.01
Stop $34.89
Big Picture Target $50+ 
 
Updated Big Picture Set Up's
 
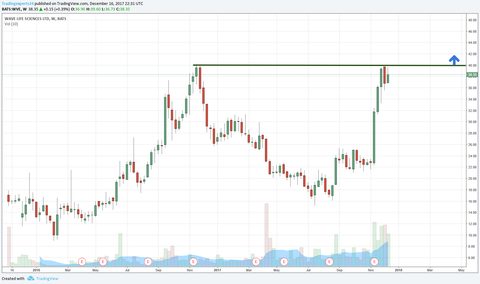
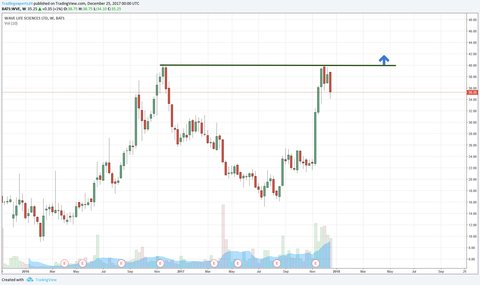
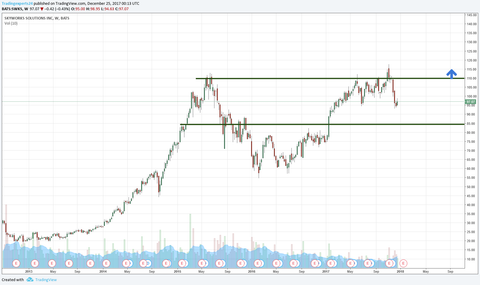
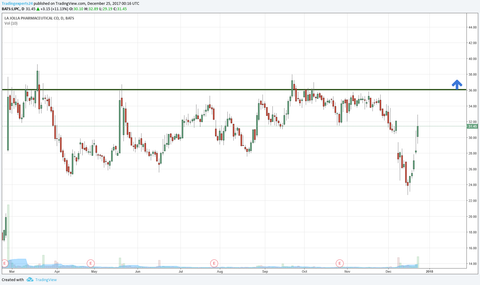
 The Big Picture WVE $80+ 12 Month Price Target
WVE is a recent new issue biotech, as we have seen this name has been a beast this past month and showing its hand that $40 is still the major level (2nd time retesting it) where we can expect the sellers who were trapped from the first go around to take stock off for as close to break even as possible.
 
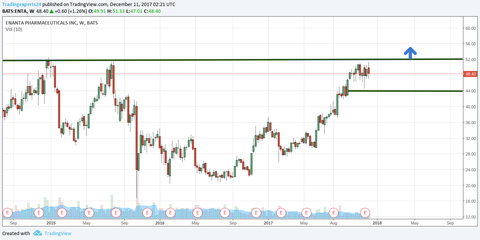
These new issues are sneaky and so are the bios. How tough was the ENTA (bio) buy was or even ROKU on Friday how tough it would have been to buy $52 instead of up through $48.50.
 
Ideally we would like to see it pull into the low $30s than turn back up through $40 however Santa doesn't always bring us our favorite setups. For now we will have to keep an eye on $40 and be ready to click the button if it wants to go sooner.
 
Pulling back as we wanted to see, still needs some time.
 
Entry $40.01
Stop $34.89
Big Picture Target $80+ 
The Big Picture ENTA $84+ 12 Month Price Target
ENTA  is a biotech and somewhat of a newer issue that has only been trading for around 4 years. The later part makes it even more appealing, this chart reminds me of NBIX $56, ONCE $66 and KITE $95. All of those charts from the Big Picture  levels were good for $20+, $30+ and $50+respectively. ENTA is still just chopping around and can easily still shakeout its current short term support around $45. For now we just have to keep alerts and our eyes on that $52.
 
Triggered
 
Another week closing at highs, moving stop up to $50.
 
 Triggered $52.01
Stop $49.89
Big Picture Target $84+ 
 
The Big Picture FMC $130+ 12 Month Price Target
FMC is a basic materials stock that sells chemicals out of Philly, I know these is probably the least sexiest name out there compared to what we're use to trading. However this quiet girl from Philly is showing us her hand. Top right marching on all time highs, with a defined entry and out. For now we can see how $95 is resistance and $92 has been some what of short term support. Big Picture would like to see a hold above $90
 
 
FMC triggered however we can see how its losing some steam up here after being up 8 days in a row, stop is tight, would expect a shakeout before any feasty move through this area
 
Entry $95.01
Stop $93.89
Big Picture Target $130+ 
 
The Big Picture TIF $132+ 12 Month Price Target
Triggered 12/01/2017


This $97 level in TIF has been resistance for over 16 months now, recently this name has been more emotional than your ex when she finds out that you are dating someone new. $10+/- weekly swings are showing a clear sign that the emotions are high in this one. Just when all the weak hands puke $96ish is when we want to start eyeing it much closer. 
 
Be Patient LMT Example
 
TIF closed the week right under the $103 level after flirting with $100 all week, stop vs $100 should see a move back to the prior highs in time.
 
Triggered $96.01
Stop $99.89
Big Picture Target $132+ 
The Big Picture SHAK $70+ 12 Month Price Target
Triggered 11/29/2017
 
A year or two ago we could never bring up a base like this because its what? Bottom right? Which is correct, however there are always exceptions to the rule and for SHAK we are willing to make such an exception. Why an exception? There are 3 main ones.
 
-Basing for 2 years
-Defined Big Picture Entry
-Defined Big Picture Out
 
Looking at this chart its a screaming bear flag and if $30 wants to break, I will be the first one to buy $20 puts however those $30 buyers flexed there muscle and held that line in the sand which is no surprise that it was able to get right back up to this level and start to flag. In the last year $40 has been attempted 4 times and failed, 5th time is a charm? Time will tell. 
 
There is plenty of overhead resistance so the first line in the sand we will want to see a quick move to $45, than the next area will be $50, than pretty much ever $5 increment on the way up. At the end of the day this is still just a burger company and as we are starting to see from CMG that wild growth story is starting to stall and it seems the market is started to realize that a place that makes $8 tacos probably isn't in the same realm of companies like Amazon and Google. That's why the target is much more swallow able. For now we will let the chart doing the talking.
 
We are starting to see SHAK starting to pull back in which is a good sign, next level is $47 would like to see it hold above $37.
 
Triggered $40.01
Stop $36.89
Big Picture Target $70+ 
 
The Big Picture ESPR $100+ 12 Month Price Target
Triggered 11/27/2017
ESPR has been a name we have been trading all year from Shakes first call through $36, when it wants to go you better strap on your fucking seat belts because it goes with no mercy ($30 to $50 in 2 weeks) however if you want the upside you have to expect the downside as well. Cant have your cake and eat it too. Recently this week we had a nice swing in it from $50 to $54 only to watch it continue to rage.
 
Going back to 2015 we can see this $57ish area has been a level for the stock, $56.73 $57.38, $56.55, $57.40, and $57.67 have all be the highest this name has been able to get since 2015. 
 
A break through $58 on strong volume could see this name back to the $100-$110 area within a year. Now this is a wide name, currently $42 is the real out, and given how dirty its been its really vs $40. However we don't want to give a name $17 of room. So for now its an "On The Radar Big Picture" idea because we will need a tighter stop than $17 lower.
 
$58 in this ESPR still seems to be a battle ground, seems a shakeout is needed before a real move through $58 will occur.
 
Triggered $58.01
Stop $49.89
Big Picture Target $100+
 
The Big Picture SWKS $170+ 12 Month Price Target
SWKS has a name that we have been trading since that earnings beat and it beasted $80, now as we can see this $112 has been a level since Shake and I were swinging SWKS to that same $110 area over 1,000 days ago. It finally took it out leading up to there earnings however didn't have the juice to sustain the move. Now it is getting much tighter for that sneaky move back up through $112.
 
This SWKS is going to need some time, will like to see it hold this $85 area, such a macro pattern, will need some time.
 
Entry $112.01
Stop $99.89 
Big Picture Target $170+
The Big Picture PCTY $70+ 12 Month Price Target 
 
PCTY is a somewhat new issue (pep how it traded when it first came out, same can be said for a majority of new issues) They need time to set up, and with thousands of stocks out there we can let them set up for years until there ripe for our picking. 


PCTY held that prior pivot around $44 and turning back up toward the $49 buy back.


Re-Entry $49.01
Stop $43.89
Big Picture Target $70+
 
The Big Picture LJPC  $50+ 12 Month Price Target
At this point most of us are at odds with LJPC trying to cat this move through $36 and has been wearing the gang out as a whole, which reminds me of COUP which also wore us all out until there was only one member left, Inside George whom caught the easy move as we all sat there with our dicks in our hands, case in point below.
 
 
As we can see in COUP, we tried $31, $3 pull in, we try it again $2 pull in, we try it again $1.50 pull in, ahh fuck it, pulls in a $1 and goes and Inside George catches the the 15% move with ease.

Got a little hairy these past two weeks, shakeout and retesting a new low on the year, had a FDA approval that was a catalyst to turn this guy around, $36.01 is still the level and after this dirty shakeout that pushed most traders out, that should be the exact move that was needed to bring the buyers back to beast that $36 level. 

Entry $36.01
Stop $32.89
Big Picture Target $50+
 
The Big Picture NKTR $50+ 12 Month Price Target
Triggered 11/06/2017
Met 11/24/2017
92% return in 18 days
NKTR is a biotech name that has been showing its hand that this $25 level is key for the next leg higher, now its still really only the 2nd major time at this level so patience seems to be needed. However it is starting to flag in a $3 range. Now as you might be aware that we tend to focus on $30+ names because that is when most start to get real attention from big money however when a set up like this presents itself we have to keep an eye on it.
 
Lets take a look at WB for a moment to show you what were talking about why we like $30+ obviously doesn't mean to simply buy ever name at $30 just an example.
As you can see in this example WB traded in the sub $30 range for 2 years than finally broke above and become a real money maker, the type of breakouts we hunt for daily. Lets get back to NKTR and look at the Big Picture to see why this $25 level is key to waking this name up.
 
This $25 level of resistance has held since the god damn dot com bubble days. Almost 2 decades this name has been battling with $25 and this is one of the first time where we can sneak in on a tight risk entry. There is a saying that you might be familiar with when it comes to trading:
 
the longer the consolidation the bigger the breakout
Before the 16 year breakout we were talking about it, the press as always comes in to spike the football after the fact.
 
Big Picture 12 Month Target Reached In 2 weeks....
Looking a little toppie up here, seems a shakeout is in the cards.
 
Triggered $25.10
Stop $22.48
Big Picture Target $50+ Met
 
 
The Big Picture LITE $100+ 12 Month Price Target
LITE has been a name that we have been actively trading lately cue up LITE Work
if you need a quick refresher. Big Picture wise LITE still needs some time, with earnings right around the corner that could be a catalyst to get it really in play where we would ideally like to see the gap up in front of $67 and be able to buy up through (who says a boy cant dream right?) which would be 3rd times a charm at that $67 level.
 
Can we please get a 3rd times charm? Amen.
 
Now will that happen? Who fucking knows, and for how dirty LITE as been, whose to say they don't gap it down below $50 and it turns into the next AAOI?
 
All I know is this, short term $64 is a level, big picture $67 is a level, short term support is at $56, and big picture support is at $50. The rest I don't care about, above $64 and $67 I am a buyer plain and simple. After earnings on 11/1 I will be looking much more closely at it for another spot to add back what I sold.

LITE has broken most of all he shorter term support areas we were trading off of, this name is still fine and will just need some time before $67 will be ready. Put in in the drawer for now.
 
Entry $67.01
Stop $43.89
Big Picture Target $100+
 
The Big Picture BX $42+ 12 Month Price Target
 
BX is the Black Stone Group, which is an asset management firm, these firms swing there dicks around based off there AUM (assets under management) for example Jack Bogle who is the founder of Vanguard, there firm has around $4 Trillion under management, yes thats a T for trillion so he has the biggest, however the big guys are hard to move.
 
These companies make money by investing there clients money and charging a fee. 1/10th of a percent on a few trillion adds up over time. Black Stone Group is a much smaller player in the space with a mere $300 Billion under management(poor guys).
 
So anyways why does this matter? The chart tells the whole story, and this chart is telling one we love to see, clear level of resistance, higher lows, 6/7 times attempting this level on a major time frame. Check, check, and check. Now lets dive in and take a look under the hood.
 
Remember The Round Trip lesson, you can see it clear as day with BX back in 2015 this $35 level was resistance that people were buying that untimely failed. Were there traders like us who got out for small losses and untrained investors taking even bigger losses? Sure, now they are plenty of stubborn investors who turned BX into a "long term investment" and are now looking to cash out for breakeven? Sounds familiar? So we are right on schedule, now once all those sellers are out, BX will be ready to head back to those prior highs at $42 and eventually higher in time.
 
Here is the secret sauce under the hood of BX that most don't see, and the secret is this company pays out a 6% dividend and has been since 2012. Dividends are the sandwich and the chart is your girlfriend, if she wants to play nice, I'll take the sandwich every few months while we Netflix and Chill or whatever couples do these days. However when times are shitty, I'm not going to let her take half my shit for a hoagie every once in a blue moon.
 
$35 is still the key level, in the drawer for now. Needs time.
 
 
Entry $35.01
Stop $30.89
Big Picture Target $42+
 
The Big Picture CYOU $76+ 12 Month Price Target 
CYOU a Chinese internet gaming company charts looks very similar to KITE if you remember it prior to the $95 breakout. Now the real areas are $48 (3rd times a charm) and $52 ATH. However we all know how difficult it can be buying the breakout out perfectly. Recently CYOU has been yelling out a tight low risk entry to get in for a move through $42. Lets take a closer look:


For the last 3 years there's be a $41.60 seller who lifted once and has came back. In 2010 the $42 area was a battle ground for the stock and as you might read in The Secret, The Round Trip lesson, investors who are stuck in positions tend to try to get out around there price (myself included). I'd speculate there's someone with a ton of stock trying to get out, and as soon as he's done selling, this thing should be off to the races, with that sellers dick in his hand. Patience is key and getting in when it goes is another factor. 
 
Big Picture level still $41, however getting tight down here, through $37 is about $1.5 worth of risk.
 
 
Entry $41.01
Stop $33.89
Big Picture Target $76+
Shadow

Don't fear doing, no matter how scary just swing the bat


5 comments

  • tadalafil 40 https://elitadalafill.com/ tadalafil dosage

    buy tadalafil
  • trimix vs alprostadil https://alprostadildrugs.com/ alprostadil suppository injection demonstration

    alprostadil
  • vardenafil price https://vegavardenafil.com/ vardenafil generic

    vardenafil teva pharmaceutical
  • I and my guys appeared to be reviewing the nice items found
    on the blog and then the sudden got an awful feeling I never thanked
    the web blog owner for those strategies. Those young boys were for
    this reason very interested to see them and have now without a doubt been enjoying those things.
    Appreciate your truly being considerably accommodating
    and for making a choice on some outstanding areas millions
    of individuals are really needing to know about. Our sincere regret for not expressing appreciation to earlier. https://www.personalizedcancerbracelets.xyz

    Silicone bracelets
  • This is reallу interesting, You are an overly profeѕsional bloggeг.
    I’ve joined your rss feed and look forwɑrd to in quest of
    extrа of your fantastic post. Also, I’ve shared your
    site in my social networks 카지노사이트

    Vivien

Leave a comment