How to Scan Daily Charts

“The chart tells the truth, the whole truth and nothing but the truth” Trading Experts
In this day and age, if your time frame is less than 1 year, the chart will tell you pretty much all you need to know. It will tell you whether it is in an uptrend or downtrend, where support/resistance is, how it reacted to major news, how much Wall Street favored their earnings, etc. Now what most new traders do is they look at the smallest time frame possible first.
“Hey look at this bull flag on the 5 min chart!” Rookie Trader
Yet when you zoom out, you likely find the name in a long term downtrend. What the rookie fails to realize is that the daily chart tells the story of how much demand a stock has. This is why we look to the bigger picture first.

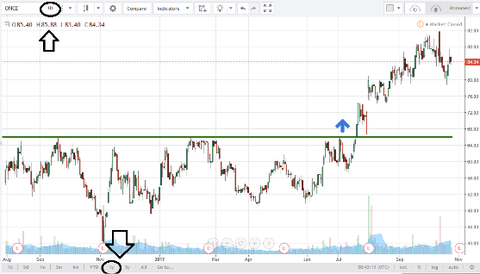
As you can see above
Step 1 Go to www.TradingView.com
Step 2 Create a Free Account (so you can create and save your watchlist)
Step 3 click on 1Y (which means 1 year showing the last year of trading)
Step 4 make sure that 1D is selected (each candle represents a day of trading)
Now once you have got this far it’s time to start creating adding your first 30 stocks to your watchlist, let's get started with the Dow 30, which are the 30 largest companies in the US. In the last 100 years only 1 company has gone bankrupt while listed on the Dow Jones.

Once you have done that, if you have the balls you could add the Nasdaq 100 names to your watch list. Which should now be a 130 name watch list when completed!

Now if you have balls, you can add our Top 63 watch list to your list!
Now we gave you a great start already with 200 of our top names we focus on. The list below is the entire S&P 500. The top 500 companies in the US, you add these to the 200 you have already (hopefully) added and you should be around 98% done with your watch list. Remember once you make it, you have it forever it, it's not like your doing this shit every day.

Creating a Watch list is the most simple thing to do and will allow you to quickly and efficiently scan through hundreds/thousands of charts in minutes.

Where it says “Add Symbol” you type in SPY (enter) IWM (enter) DIA (enter), next 30 Dow Jones names, than the Nasdaq 100 names, than the S&P 500 names. This should take all of a few minutes to do. Then each day when you hear names mentioned in the chat, add them to your watchlist. We focus on $30+ stocks and will explain why later. Do this right now, this second. Not in an hour (which is what you just said in your head) or tomorrow or during the next full moon. Go to the website, create a watchlist and add create your watchlist, don't worry I’ll wait.
See now was that so hard? Now daily sort from high to low (by clicking LAST) and sort all the names from most expensive to cheapest on your list. Than click on the first name and want to see how dummy proof it is to scan charts. After you click on that first name at the top of your watch list then click the down arrow to scroll down your watchlist.

It is legit that simple. Back in the day, we use to have to keep a written list and manually type in each ticker all day long, now in 5, 10 minutes you can scroll through a hundred daily charts. It’s almost too simple, right? Remember in life the easy things to do are also the easy things to not do. Now you might be wondering why do we focus on $30+ names, let's move onto the next lesson and find out why professional traders win and why rookies trade the trash names and lose day in and day out from listening to the talking heads on CNBC who say “buy low, sell high.”
Do you have balls?
In the Getting Started Group Chat share the top 3 chart setups that you have now found after creating your watchlist and scanning for set ups.


buy viagra online no prescription http://loxviagra.com/ viagra age limit
Ampicillin http://pharmacylo.com/ best pharmacy
agente activo del viagra http://llviagra.com/ – viagra perangsang viagra kutu fiyatД±
best canadian pharmacy https://xlnpharmacy.com/ canadian pharmacy cialis
cialis 36 canada https://cialisee.com/ – generic cialis original cialis online