


________________________________
Broad Market Outlook
We hit new all time highs this week, just say that out loud for a moment, we hit new all time highs in 2020. In a year that the market dropped over 36% in a month of trading, 6 months later we are right back at new all time highs.
This trend continues to cement in my broader thesis that with information being disseminated at faster rates each subsequent crash and recovery are becoming faster (2008 was a 5 year round trip, 2015 a 2 year trip, 2018 one year, 2020 half a year).
With the SPY flagging as tight as possible near this retest, it is quite possible that we continue to drift higher similar to what happened with the consumer discretionary sector.

Spare my elementary paint skills but you can see the similarities with consumer discretionary showing us what could be in store to the upside in the broader market.
But what about the downside? When the markets are at highs, I find myself as you too might find yourself 100% invested in the market. That combo tends to make me feel a bit cautions, and as we see each pull back becoming smaller and smaller. Eventually that trend has to crack, just like we saw in February (chart below).

We can see how leading up to the crash, each pull back got smaller and smaller until the doors got blown off. But the horizontal line shows what was the prior high at that time and that we still drifted much higher before the crash. Could the same happen again? Its quite possible.
That is what people forgot during the recent crash and that was the fact we just gave back open PnL market wise given back after the monster run we went one.
The chart below shows the recent pull backs following a similar trend of 2019 as we ran back to highs then drifted higher, the pull backs are continues to become non existent.

So who is to say that this time wont be like the last, where we continue to drift higher and work our way towards SPY 4,000 before the next shake out.
That is anyone's guess, and if we continue to take the set ups that are working for us and respecting our stops then we will get pushed out early during the next correction or crash.
Throughout each trading crisis the Alpha chat has been able to think and act more level headed and calm each time. So let's continue to think and act rationally no matter how crazy the market and its participants get.
______________________________

______________________________
Macro Rotation Outlook
SPY

Dow Jones

Nasdaq

MDY Mid Caps

IWM Small Caps

________________________________

Discount Code Alpha20
______________________________
Sector Rotation
Sensitive - sectors that have moderate correlations to overall market conditions.
VGT Tech

VDE Energy

VIS Industrial

VOX Telecom

________________________________

________________________________
Cyclical - sectors that are more sensitive overall market conditions.
VAW Materials

VCR Consumer Discretionary

VFH Financials

VNQ REIT

_________________________________

Next week the winner is announced!
_________________________________
Defensive- sectors that tend to outperforming during sub par market conditions.
VDC Consumer Staples

VHT Healthcare

IBB Bio Tech

VPU Utilities

______________________________


______________________________
Big Picture Set Up
CAT

CAT has been battling with $140 all year long, breaking it and getting stuck under it, this is the first time where we can take a shot at $140 with the tightest amount of risk. Just imagine if you were trying to take this $140 breakout all year how mentally drained you would be with all the failed trades, yet we are coming in fresh.
MYOK
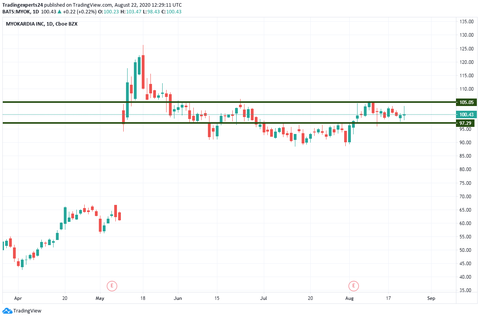
Solid earnings base forming in this MYOK for almost the entire quarter, this is a prime example as to why if you hold through earning and you are right, the mindset needs to be at least until the next earnings report.
We can see $105 has started to become a level and once it can break through that the next stop is the retest of $125.
SBAC

We can see this SBAC flagging near all time highs, $320 is the all time high level however we could sneak in up through $310 to be better positions if SBAC is ready for $320 in time.
V

We did a great job being patient with this V and getting in as it started to fill the gap, for now my stop is break even with my primary goal to hold at least until the retest of the prior all time high at $215.
