


The Big Picture Outline
- Broad Market Outlook
- Macro Rotation
- Sector Rotation
- New Big Picture Idea
- Updated Big Picture Idea's
(click on each chart for a bigger version)
Broad Market Outlook
The week in short could be summarized as chop, nothing really exciting other than LULU stock wise. Which if your in it, be god damn patient, we got chopped up for it for 2 months, if your in and selling it 1% higher, its a waste of time. Be patient and let it work.
Market closed the week more or less in the same spot we started it, in this short week felt like the world was going to end and by Thursday we could hear the optimism in most. Facebook and Tesla showed us this week that even the leaders can get smoked and when they do how the overall conviction in the market gets put into question. Fun fact last time FB dropped 18% was over 2 years ago from its high to low.
You probably started to notice how quick the tune on these companies can change, when there at highs, they changing the Ad business and sending cars to mars (a marketing stunt, which requires a golf clap to the marketing legend of the century Mr Musk). However once there is a small chink in these leaders armor the shit comes down fast as does the stock.
The markets have been choppy there is no doubt about that however there has been this over analyzation of the SPY with members sometimes even posting 5 min charts of the SPY. Ask yourself one question, what market is leading us higher? The answer is NASDAQ and we focus on tech and bio's for the most part. Why are we focusing on the number 2 on inconsequential time frames?
Steph Curry (Nasdaq) is dropping three's and most are watching the guy who passes the ball to him (whoever the fuck that guy is). What is even worse is that this new SPY fan club is looking at shit that simply doesn't matter.
Know the major levels, and focus on what matters, the stocks we are trading, sure check the SPY once or twice a day on the daily to get an idea of where we are at. However posting a 5min chart or hourly is simply drinking the koolaid that will only cause you to become trigger shy and rethink a buy in a stock that is about to break.
Seems that we are going to be in a range bound market for some time however don't get down and out just yet, these ranges have been huge with opportunities everywhere!
Also keep a look out for a new program that we are coming out with from lesson from Dumb Money in April!
Macro Rotation Outlook
Nasdaq 8400+ 12 Month Target


 MU had to shake the tree before that monstrous breakout, we want a shakeout in LULU to get ready for a feasty move through that $82, a push down through $75 would be ideal.

 We got jerked around for months in this LULU and it finally broke on great earnings, be patient, this is all new price discovery, pick an amount of stock that you are willing to give back to $77.89 and lock em away. Trade the rest how you see fit, however if we had to flip a coin and say LULU higher or lower than $78 in 3-6 months would have to say higher. Should be looking to at least to $100 for now.

 Higher lows holding up so far however still a ton of room needs to be given, needs time to tighten up.


 Seems as if a retest of the low $90s are in order before any real turn around.

 We are seeing how $118 is the level however in these thicker names it tends to be easier to get cheaper stock that buying the breakout, will still add to $116 vs $112


This seems to be the new range we will be in for the upcoming week, below 6400 would expect a retest of 6,200 even a shake to 6,000 could be very healthy for the market, as we have seen in the past, the SPY retest the correction lows 4 times before getting out of that range, as mentioned earlier, feel this year will be more of a range bound/consolidation year which may sound shitty to most, however think of the range we have been in since Jan, sooo much going on.
SPY 300+ 12 Month Price Target

Lets try something for a moment, take your index finger and point it point down on whatever table or surface you are near, start at the highs of the market and try to trace the broad "h" move so far and as you finish drawing out that pattern, where does your finger end up? Lower or higher?
If you actually did that weird exercise you more than likely ended lower however at a certain part stopped the downward pressure, below $257 in the SPY we could expect that same down move that you drew out with your finger, towards $250 which would be completely fine, usually in this fast down moves or continued selling we want to see a sharp snap back off lows, when its just sitting there and you can get so close to the buy vs support tends to be a cautious sign.
Another subtle sign was in the past month above $270 was the risk on line in the sand, now its $3 lower at $267.
MDY Mid Cap Stocks $400+ 12 Month Target

MDY similar story as the SPY, new line in the sand to the upside is $4 lower, looks as if we might tickle this $344-$348 before trying to roll over and take out that prior low, time will tell.
IWM Small Caps 200+ 12 Month Target

Resistance turning into support right in the middle of this range, the value buys seem to be sub $150 while the risk on adds seem to be above, for now seems best to wait until a clearer sign or deal presents itself.
VGK Europe ETF $82+ 12 Month Target

VGK $59 has been starting to become a level, will take quite some time to take out those prior highs so dont be the house on the $59 buy, simply just an area to add.
VWO Emerging Markets +$58 12 Month Target

$51 is the real spot for the breakout for now we will have to see if $44 will be able to hold up.
EWJ Japan +$85 12 Month Target

EWJ starting to show some legs at $57, going to need sometime before $66 however slowly starting to pick some up for that move should pay off down the road.
INDA India +$53 12 Month Target

Prior resistance turning into support, above $35 could be an area to start slowly adding to this country.
10 Year Treasury Note Yielding 2.83%

10 year T Note has been in this range from 2-3% in time we should see that 3% breakout in time, we just want to make sure the 10 year is always yield more than the 2 year T Bill.
You might start to hear terms like "inverted yield curve" in the media (turn off the tv). There is one historic leading indicator that will give us a big red flag that a recession is on the horizon which is an inverted yield curve.
Very simple an inverted yield curve is when the 2 year Treasury Bill pays more than the 10 year Treasury Note.
Right now 10 year Note is yielding 2.74% (higher = good)
Right now the 2 year Bill is yielding 2.27%
Were Gucci however when the 2 year starts to yield more than the 10 year, that's a red flag.
USD

USD still relatively weak across the board, remember weak dollar is good for US stocks.
OIL

Oil has been battling with this $70-$72 for quite some time, above it we should expect to see the oil names (obviously) rally. Fun fact there is 42 gallons of gas in a barrel of oil which comes out to around $1.66 per gallon. So when your at the pump paying $3-$5 now you know why these countries fight over it so much.
Sector Rotation
Key points
- For any of the major markets or sectors, we are parking these positions in a taxable account looking to hold for a year plus (Long Term Capital gains)
- Meaning we are willing to hold positions against us as overall sectors and markets are much less volatile than individual names.
- We are buying or adding (dollar cost averaging) when there are actionable set ups.
- We are selling for either profit or getting out for breakeven if better opportunities arise elsewhere in other sectors.
- If you plan to add this strategy to your portfolio please discuss it will me so we can make sure you are not parking these ETF's in retirement accounts locking up tax deferred capital that can be put to better use in individual stocks.
VGT Tech

Long term trend line still in tact and chart wise $180 looks sick in time, we should expect that $180 to become a hard level of resistance for some time as this pattern continues to develop. Above $180 should had a move to $200, that long term support breaks could easily see it at $150 as well.
VIS Industrial

Since November this sector as a whole is almost 40% as a whole, just say that out loud for one second, if you simply held this ETF of the entire Industrial sector for 5 months you would have made 40%, and as we can see as of late the sellers have been coming down, $150 than $147 now $140. Even individual name wise there has been some crazy runs however it seems its losing some of its juice and needs to start causing more pain where it would be time to get off the ride or keep a tight stop vs $136.
VCR Consumer Discretionary

Last year for pretty much any sector you bought was like those first few months of dating, where everything is perfect and she or he is just to die for. As of late, its fast forwarding to year 5 of marriage with 2 kids and those 6 inch heels she use to wear are replaced with Uggs and sweatpants. You can salvage the relationship it just needs time and effort.
VAW Materials

Now were getting somewhere with an actual set up, so it took out those prior lows and is a text book "h" pattern, the main set up for most would be to short the $126 break for continuation to the down side which is the more probable outcome. However its not guaranteed as in any trade, if it wants to hold here and form a double bottom, it could snap out of this range for at least a pop to $138. Above $130 I will slowly try to nibble on some vs $126 if you are taking it as a trade.
VHT Healthcare

VHT is somewhat similar to VAW, h'd over and is now holding $150, below $150 look out below as the measured move would be to around $135 however if it can hold in here could get a nice bounce. $155 has been the spot however same theme as the rest, not betting the farm on any sector, simply just adding weekly into spots where it makes sense and upping stops where it makes sense to continue to rotate.
VDE Energy Sector

VDE just keeps getting tighter and tighter, we have the diagonal lines of the bigger picture wedge pattern that has been forming for years and than as of late we have the horizontal lines showing the base or bear flag that is forming, so far the buyers have been holding $90 and the sellers are still there at $94. Will continue to be adding to $94 to break that seller for a move above $100.
VFH Financial

Similar to Industrials, Financials as a whole were up almost 50% in the last year which is a huge move for an overall sector, seems more blood is in store before a break of $76 to new highs.If there is still some juice in the tanks above $70 vs $67 could make sense.
VDC Consumer Staples

VDC $131 is the new line in the sand as $142 seems to be the line in the sand on the upside for now.
VNQ REIT

Avoided the pull in, however did not capitalize on the pull in, above $76 in time however to press it here vs the lows seems like a tall glass to expect it to just rip back to the $86 major level of resistance.
VPU Utility

Still seems to have a seller at this $112, for now $108 is holding and eventually this $112 should break just needs some time to pull in and attempt it again.
VOX Telcom

Still very week and seems like a retest of those prior lows are in the cards, for now just holding collecting the 4.14% dividend this sector pays out while we wait for a better set up.
The New Big Picture Set Up
The Big Picture MOMO $70+ 12 Month Price Target

MOMO has been on our radar as of late from a technical standpoint, however do you know what MOMO does as a business? Crazy question I know, however they are the Chinese Tinder. I don't want to get too deep into the fundamental story because were traders however knowing this information and seeing how successful both Tinder (owned MTCH) has been as well as Bumble (owned by Badoo private). Both extremely successful business here in the states, however in China its a much bigger market that people are willing to pay for. Now MOMO is a subscription business which is consistent however it is not a sexy bio tech. Need to hit up the Red Army and find more out about it if it really is the next Bumble of China or the next Tinder.
Chart wise could sneak in at $38 however it seems best to just let this thing really set up and take it through $40 and look to add above $46 which is where we should expect the real move to be.
Feeler $40.05
Entry $46.05
Stop $32.89
Big Picture Target $70+
The Big Picture's Updated
The Big Picture WVE $70+ 12 Month Price Target
We caught a nice move in WVE where a few of the members literally caught the top of the short term move for over 30%+ in a week, I on the other hand was not watching it as closely and got stopped out for most for a measly 19%, cue up the baby violins.
Recently it started to drift back down towards the prior breakout level of $40/$42, so far I have taken two small shots in it and see how I am just too early which is fine with me.
It closed under $40 and other than $37 below that line in the sand it has a far way to go until the next pivot. For now its just on the radar for adds above $42 for an eventually move to retest those prior highs and down down the line to take those highs out. Given the blood in the streets this week, felt it was best to have this more of as a stock to watch not a stock to go out and buy just yet.

Started to add above $40 and will look to add $42 in time as well.
Feeler $40.05
Entry $42.05
Stop $36.45
Big Picture Target $70+
The Big Picture LULU $110+ 12 Month Price Target
This LULU has been wearing down the patience of most however Big Picture wise its just chilled and for the most part has been doing everything we would want in a stock. Consolidating at highs on tight risk. For this name to really get going still feel it needs to really shake the tree before we are going to see a powerful momentum break of $82. Lets look at MU for example.
MU had to shake the tree before that monstrous breakout, we want a shakeout in LULU to get ready for a feasty move through that $82, a push down through $75 would be ideal.Now lets take a look at another name that spent a few months also consolidating near highs. Same name also had a shakeout that is barely noticeable on the chart now before ripping for months.
In LMT I just kept buying it the tightest flag for months only to eventually stop myself out the day before the start of what became a $100 point rally. LULU is reminding me of the same story.
 We got jerked around for months in this LULU and it finally broke on great earnings, be patient, this is all new price discovery, pick an amount of stock that you are willing to give back to $77.89 and lock em away. Trade the rest how you see fit, however if we had to flip a coin and say LULU higher or lower than $78 in 3-6 months would have to say higher. Should be looking to at least to $100 for now.
Triggered $82.05
Stop $77.89
Big Picture Target $110+
The Big Picture JAZZ $220+ 12 Month Price Target
JAZZ has been off our radar for almost a year now as we last tried it through $156 however we were too early. Recently it has been started to set up for a move through $156/$160 eventually through that area we should see JAZZ take out those prior highs.
 Higher lows holding up so far however still a ton of room needs to be given, needs time to tighten up.
Trigger $160.05
Stop $144.89
Big Picture Target $220+
The Big Picture SWKS $172+ 12 Month Price Target
This SWKS $112 has been a level since Shake and myself were trading next to one another on the Mook desk. This $112 looks sick however we want to see it pull in and settle out a bit, as its just ran $17 points in a month. Earnings are out of the way and tech has already been leading this market higher. We give SWKS the proper room and $112 should be like CAT $114 that was good for $50-$70 in a year.
SWKS tried to get back in earlier this week and got caught in the gap down, after putting in the LOD, adjusted my stop to that low and got taken out and boy am I glad for those sell stops, down a quick $15, have to remember just as fast as they rise, they fall even faster. $94 huge line in the sand, would expect to see that level get tested or flush to fuck the most people. If it does will look to nibble up vs whatever the low is.
 Seems as if a retest of the low $90s are in order before any real turn around.
Trigger $108.05
Stop TBA
Big Picture Target $172+
The Big Picture CVX $160+ 12 Month Price Target
We made a mistake when we were focusing on the energy sector and that was focusing on XOM sure chart wise it was a great value play and had the smallest amount of risk from our entry the overall headwinds were still south.
Yet the leader CVX received much more love. So far we can see how there's two key areas we want to watch, $120 and $134 while the real line in the sand has been above $100 in CVX for going back as far as October 2016.
If Energy continues its overall weakness as it hovers near support of its wedge, we want to keep an eye on CVX to see if it can hold up vs $100. If it can great signs where we can start small and add through levels. This will be a patient one. Remember this is a heavy thick oil name, not a light and wide bio tech.
 We are seeing how $118 is the level however in these thicker names it tends to be easier to get cheaper stock that buying the breakout, will still add to $116 vs $112
Entry $116.05
Stop $111.89
Big Picture Target $160+
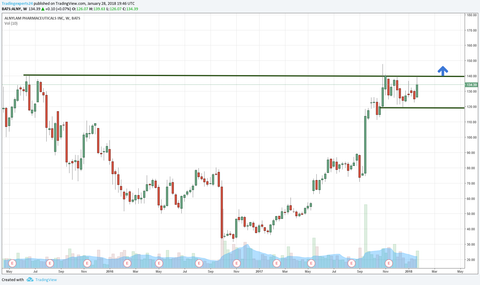
ALNY $280+ 12 Month Price Target
ALNY has been setting up for this $140 level for quite some time now, which looks somewhat similar to ENTA a prior Big Picture Idea that's up 50% in 8 weeks. Now will it trade exactly like ENTA?
Probably not, however chart wise we know $140 is the level that we need to be in for.
ENTA took around 2 months near highs before going, ALNY has been flagging in this $20 range for 3 months now.

Woof that was quick, from a 20% swing in a few days that would have all been gone, glad we were taking profits, and not fighting this shit on the way down as it dropped $30 points in a weeks time (they fall just as fast as they rise). $108 has held up twice and now the 3rd time heading there not the best sign. For now the add is $132 which is far as shit and for good reason, we dont want to be near these things on the way down. Lets give it some time and we can sneak back in up through $124.
Entry $132.05
Stop TBA
Big Picture Target $280+

Muchas gracias. ?Como puedo iniciar sesion?